N.I.N.A. Session Analysis - Version 2.3

You want to improve your images? Do you know, what you can improve? You can inspect all log files, have a look at all your image data to find out what’s going on.
Or you can just use a tool, which helps you to analyse your last imaging session in with all details much more comfortable. You can find out, if something went wrong during the night, you can optimise the imaging time during your session or improve your autofocus or guiding settings or the times spent on filter changes. N.I.N.A. Session Analysis is there to assist you.
This macOS application helps to analyse Imaging sessions done with N.I.N.A.
Requirements:
- Intel/ARM based CPU, macOS Sonoma 14.4 or higher
- N.I.N.A: Session Metadata Plugin installed (csv and json supported)
- Images stored as FITS or Raw Format for DSLR cameras
- ImageMetaData file from the Session Metadata Plugin (newest version required for DSLRs)
- PHD2 Guiding Logfile (optional the Debug log too)
- Optional: Weather data
- Optional, but recommended: N.I.N.A. Logfile
Features
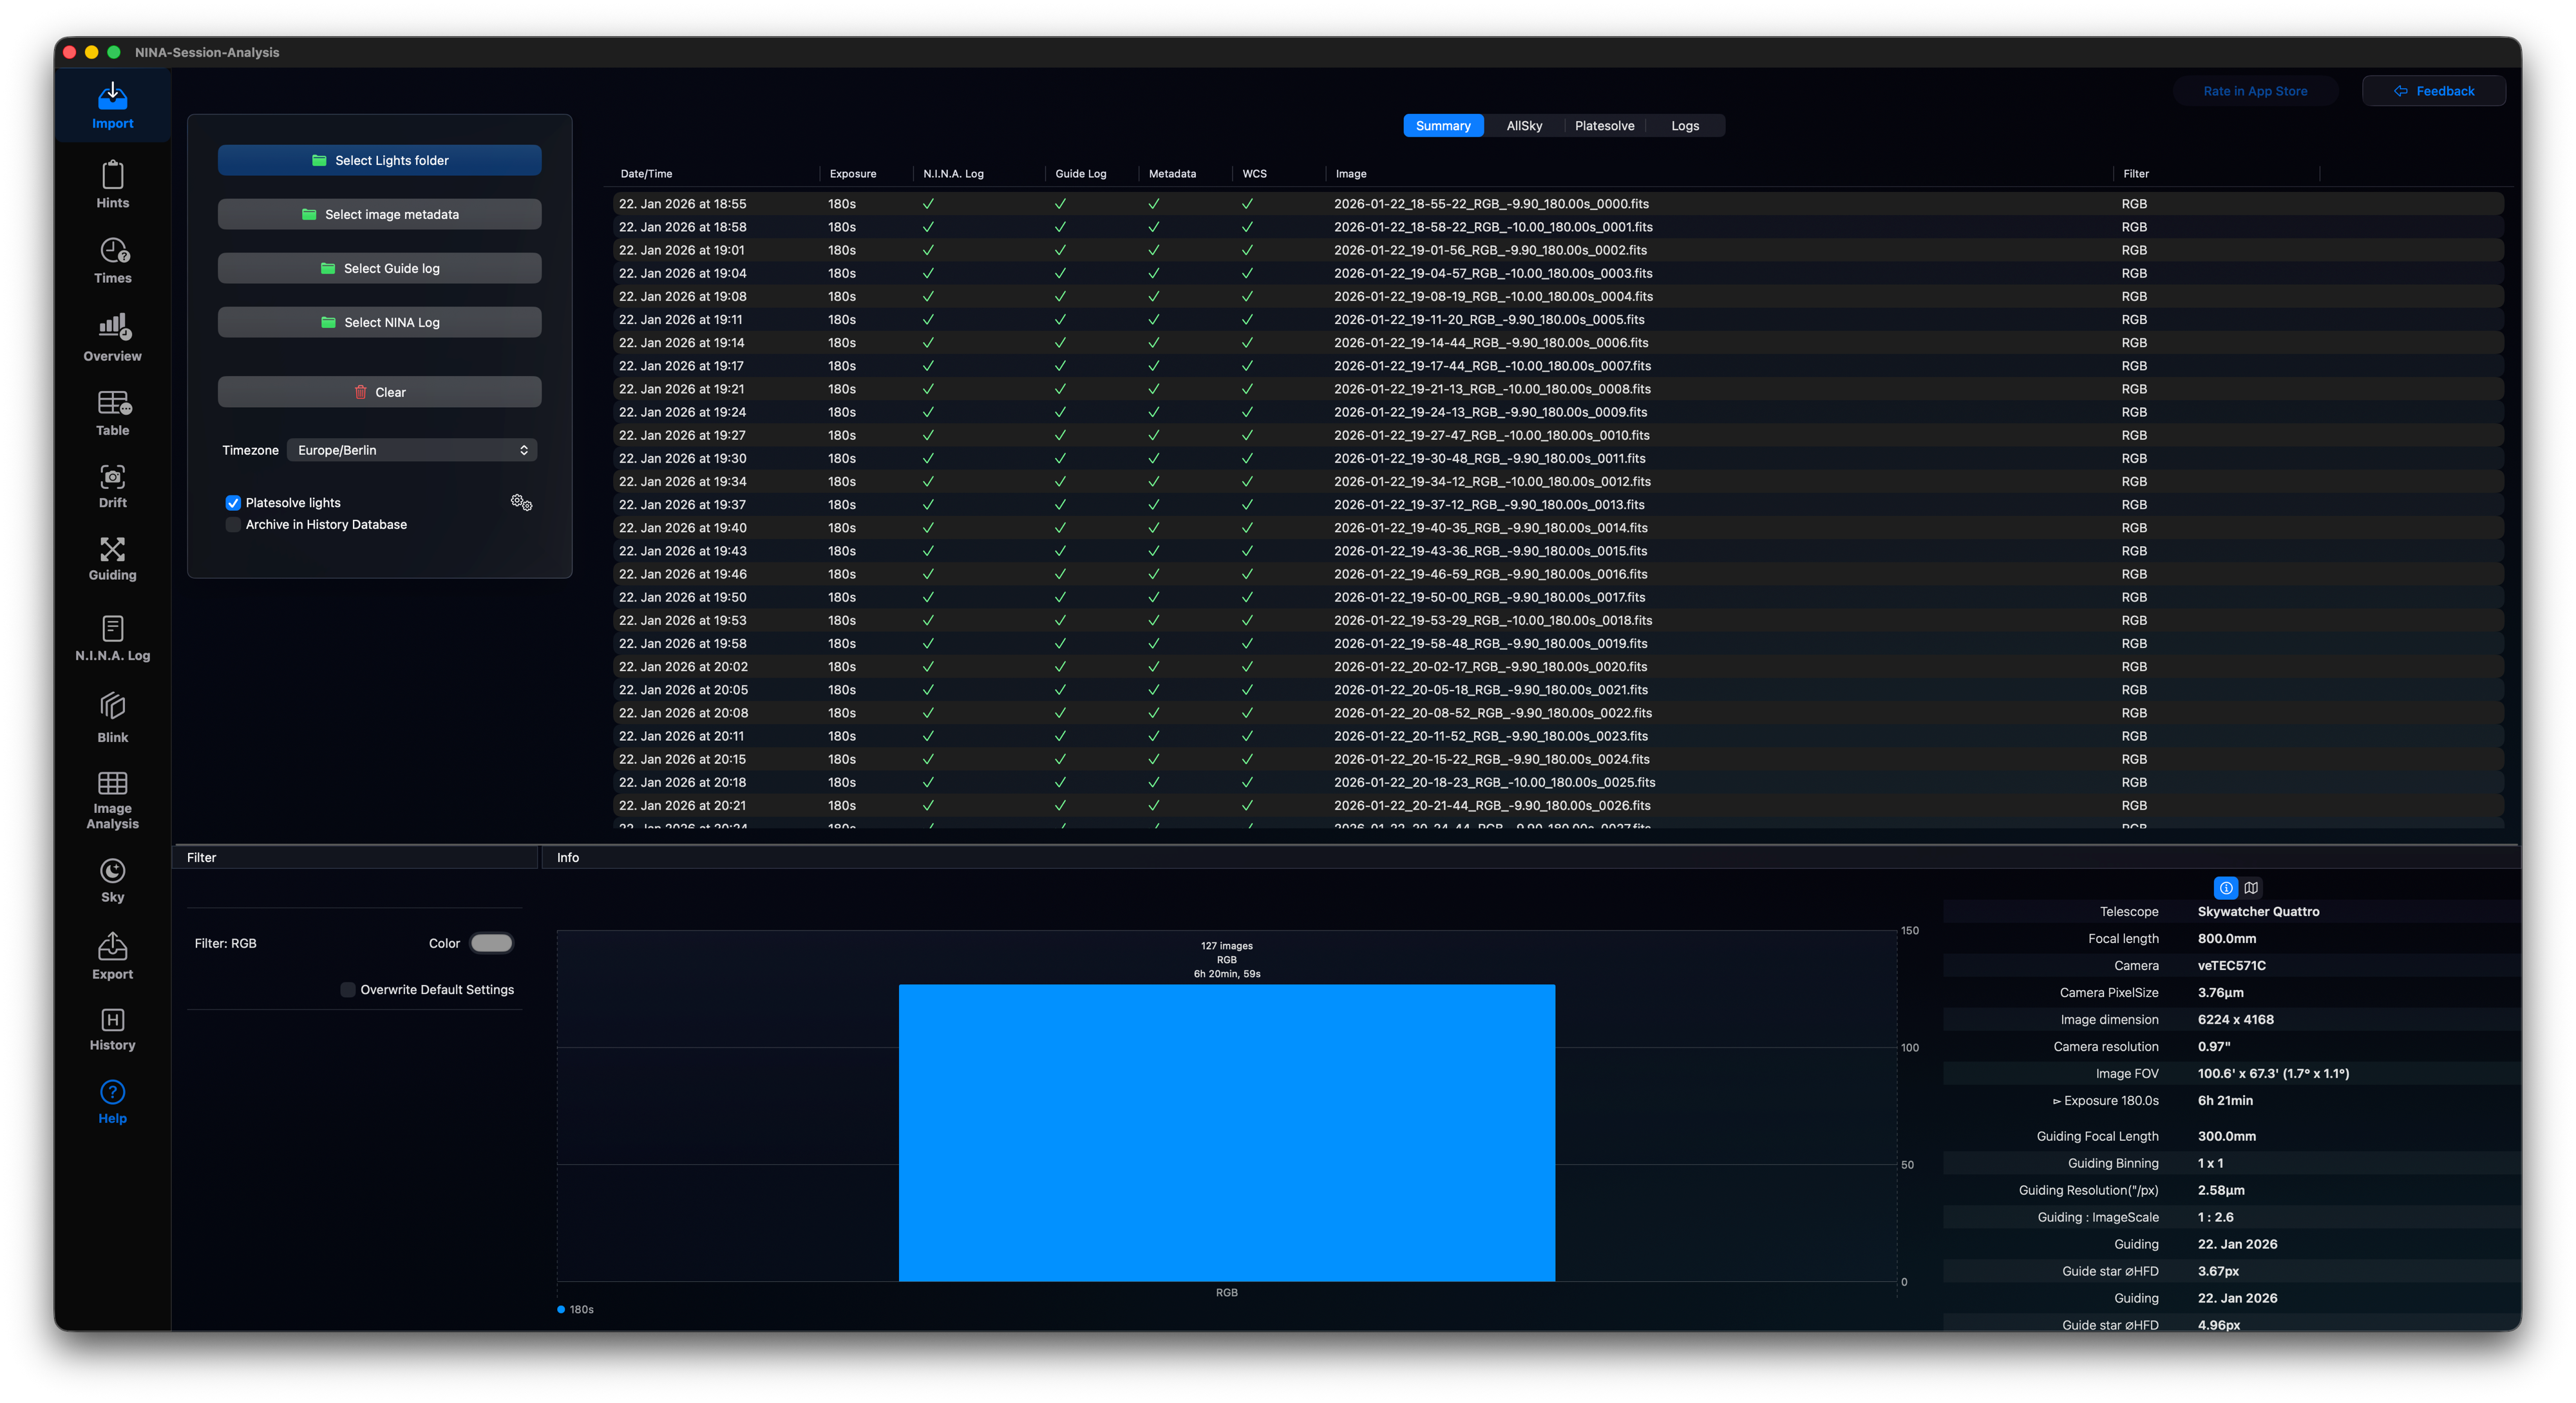
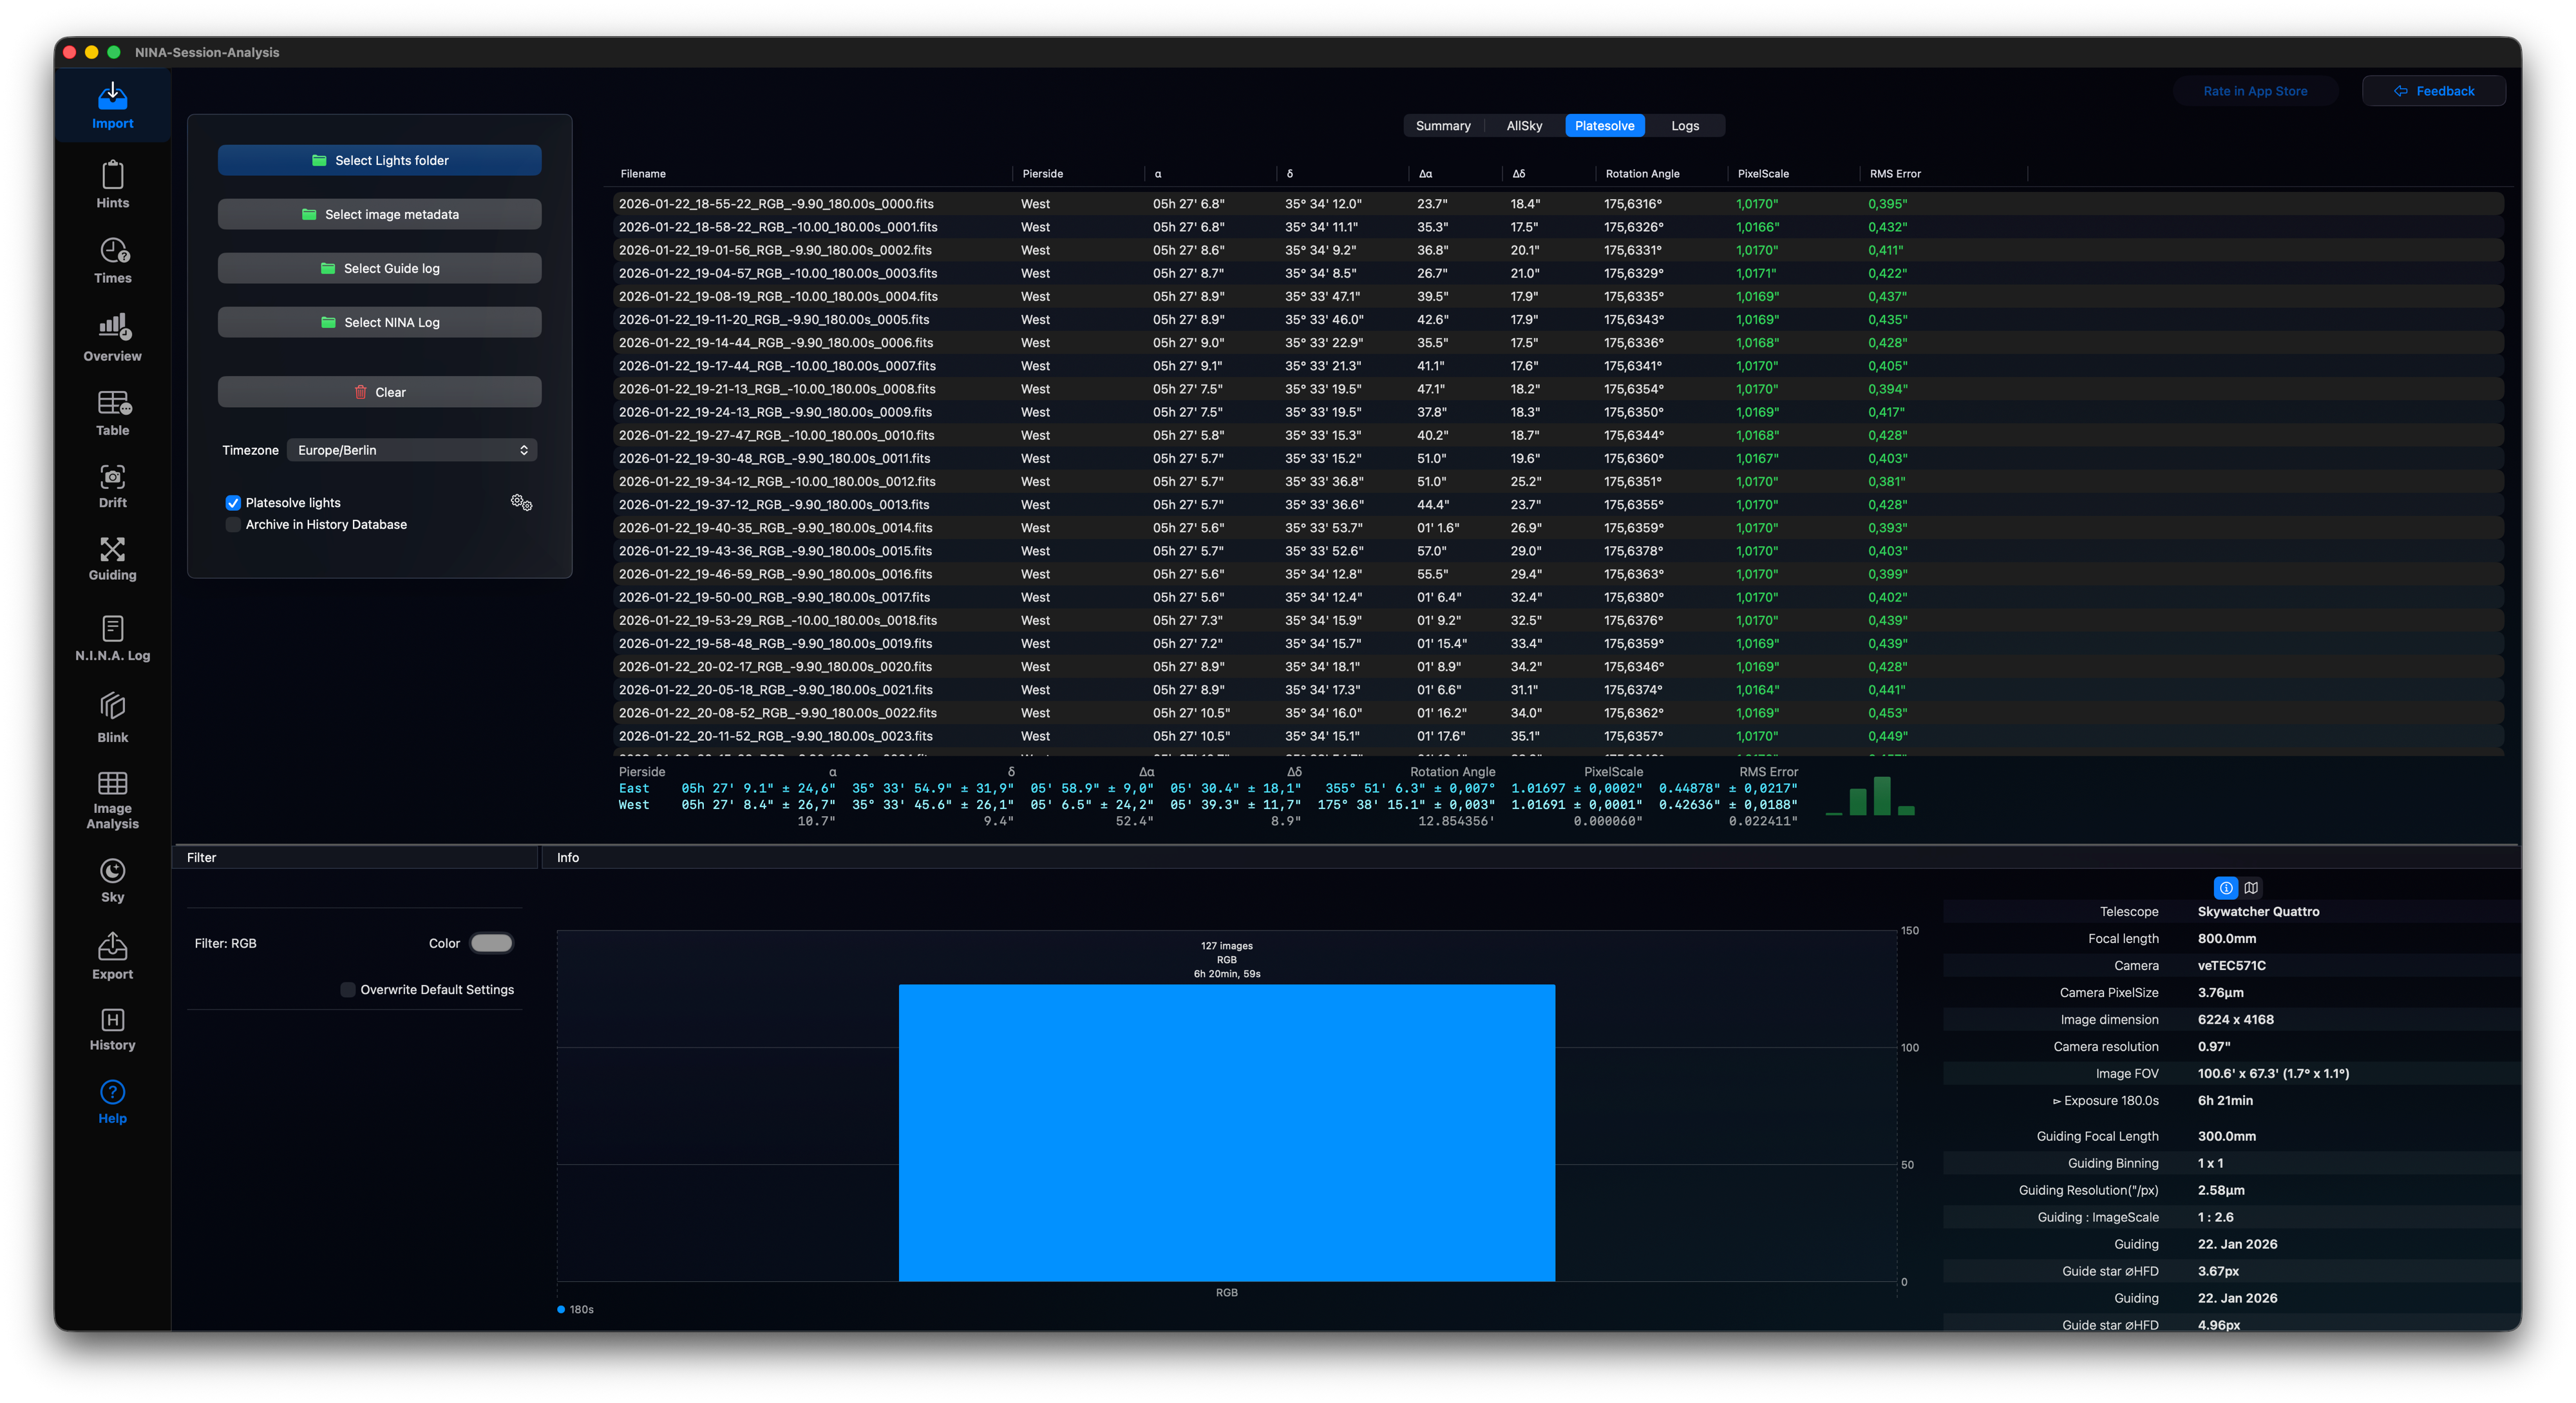
SSelect the folder where your lights are stored. You can also select sessions over multiple nights. For your convenience, the folders should also contain the ImageMetaData.csv files, the PHD2 Guidelog files and optionally also the NINA Logfiles. The app will scan these folders and will automatically read all the available information and will analyze the images. You can also use alias folders! If you enable platesolving, all lights will also be platesolved, which will be helpful for blinking between the images. You can also automatically reject lights, where your mount drifted to far away. You can also archive all your sessions into a local database for later analysis.
Lorem ipsum dolor sit amet, consectetur adipiscing elit. Aliquam tincidunt lorem enim, eget fringilla turpis congue vitae.
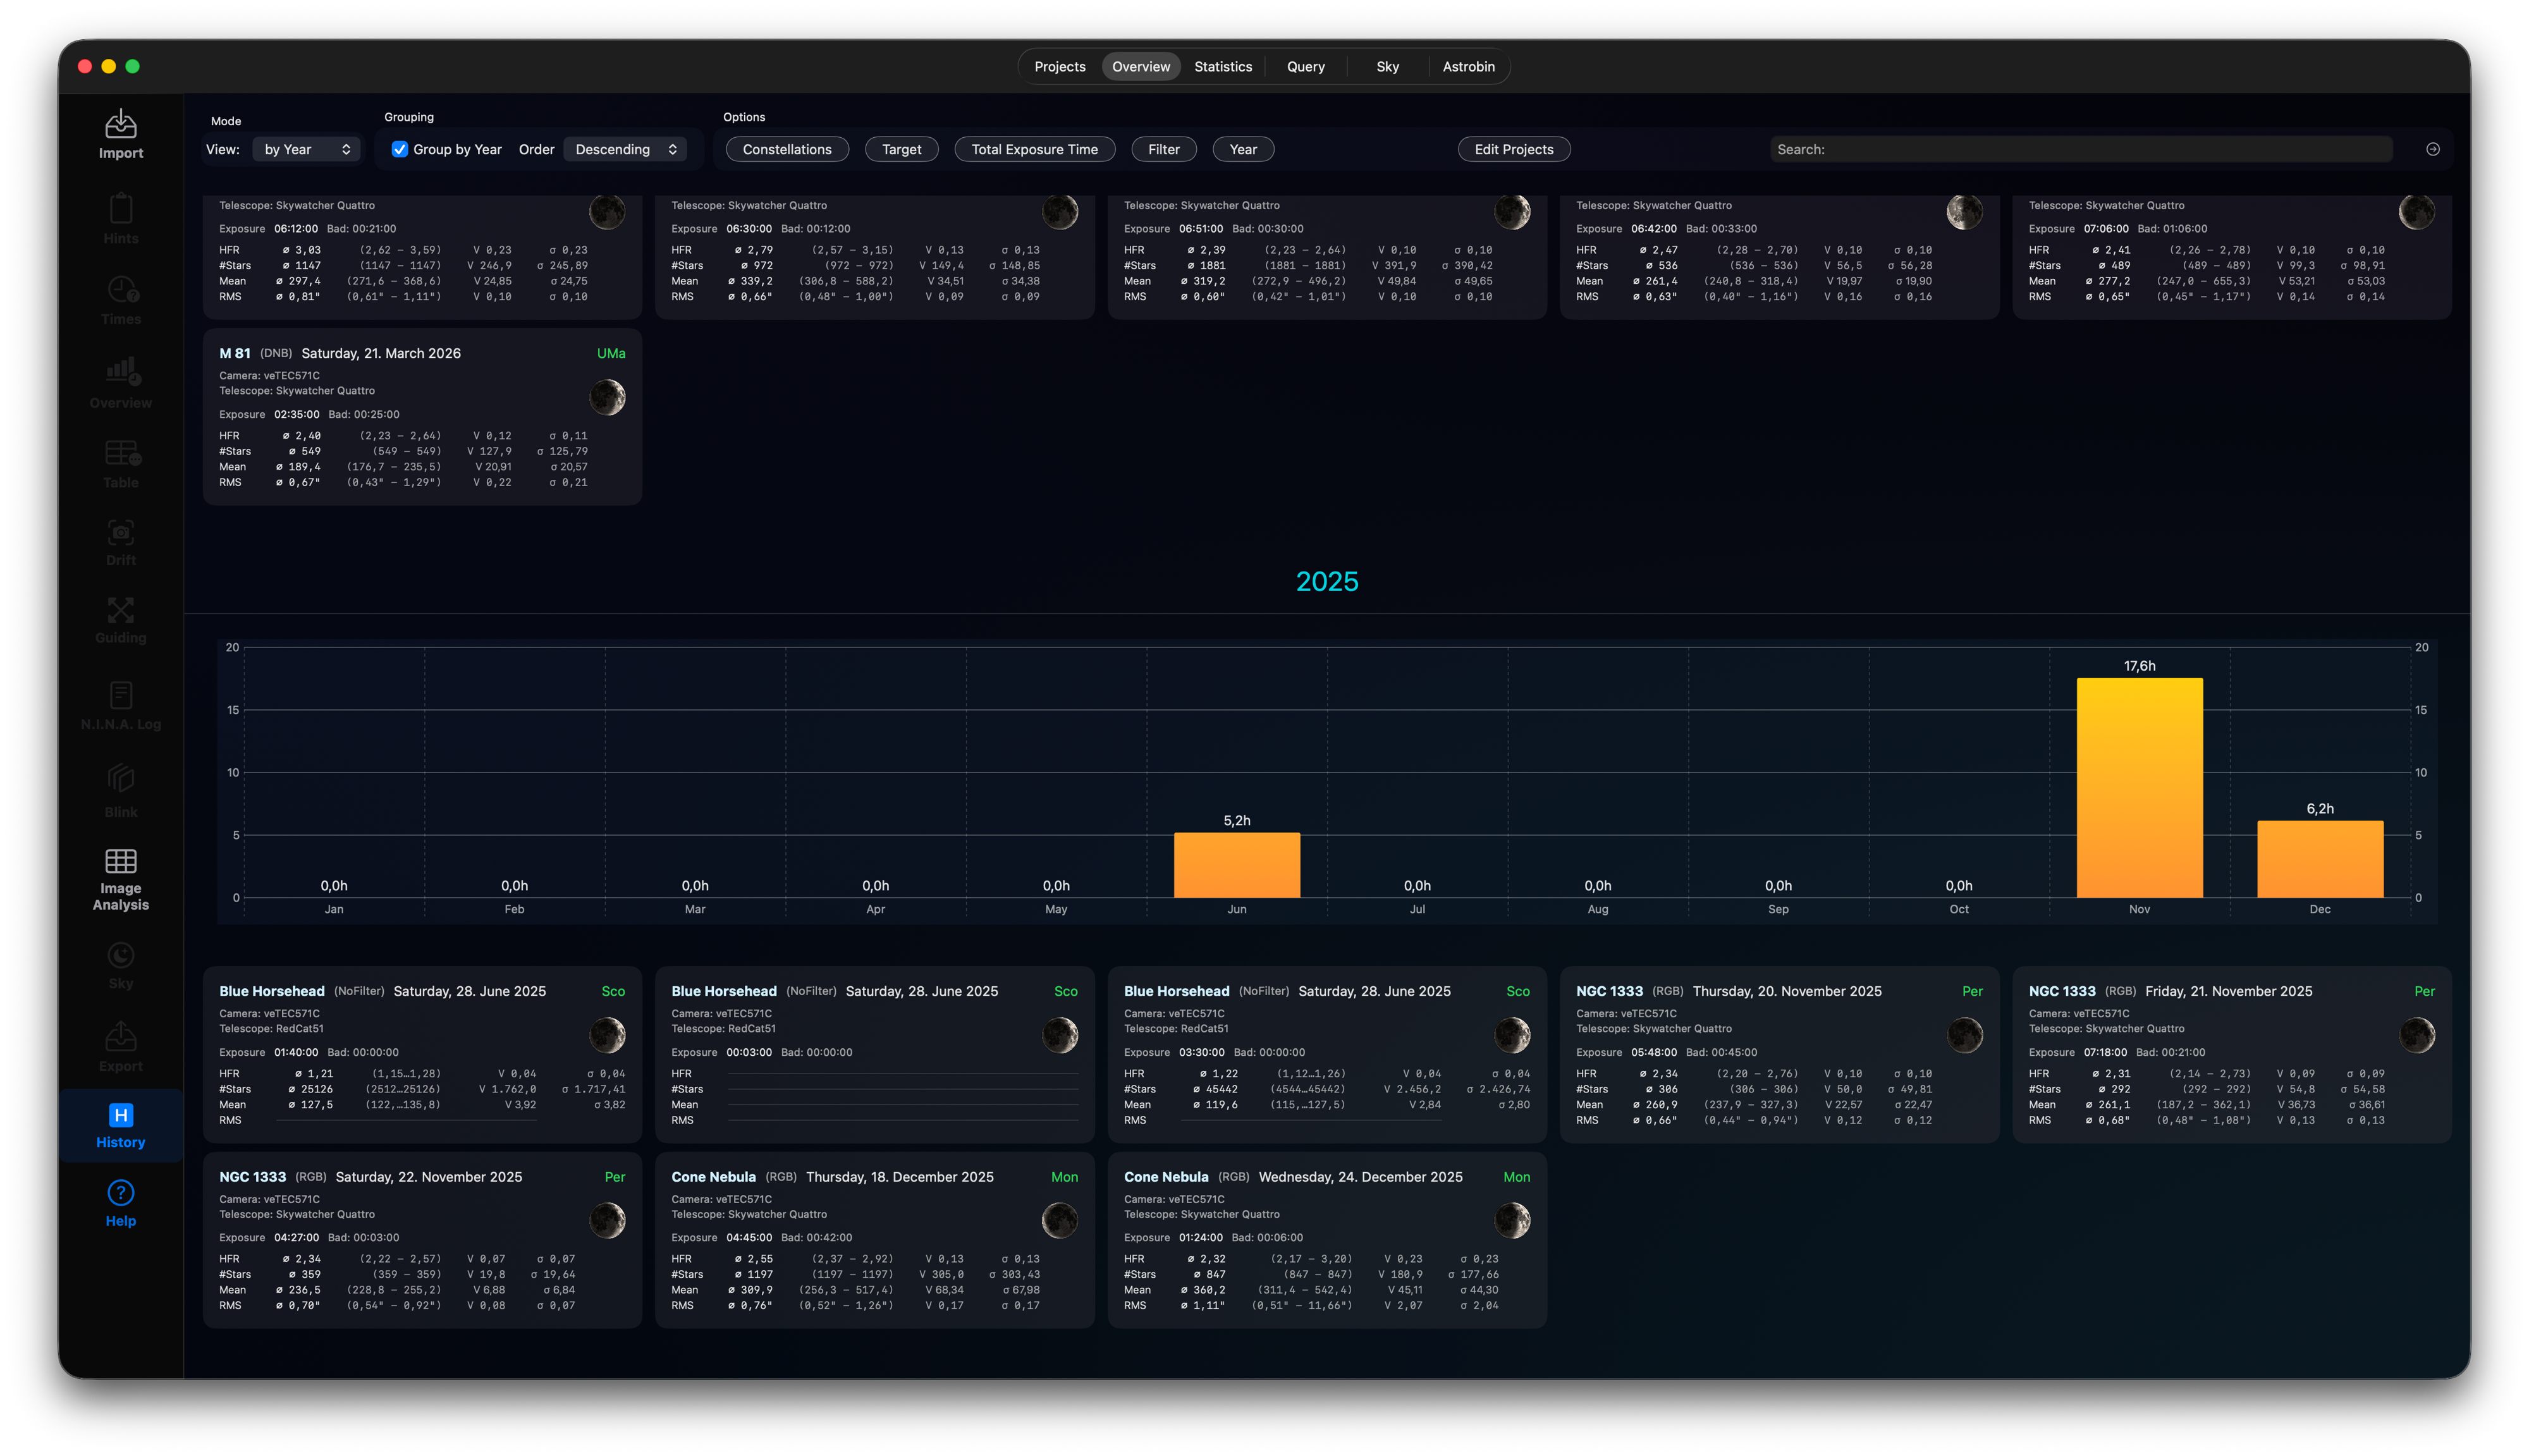
Now you can inspect the results of the imaging sessions. You should start with the overview. A lot of mostly interactive charts will give you a good summary of your imaging performance. Clicking on the charts will give you different charts on your screen, where you can click and inspect the image data. These charts also include AutoFocus Runs (NINA log file required, tested only using Hocus Focus Plugin).
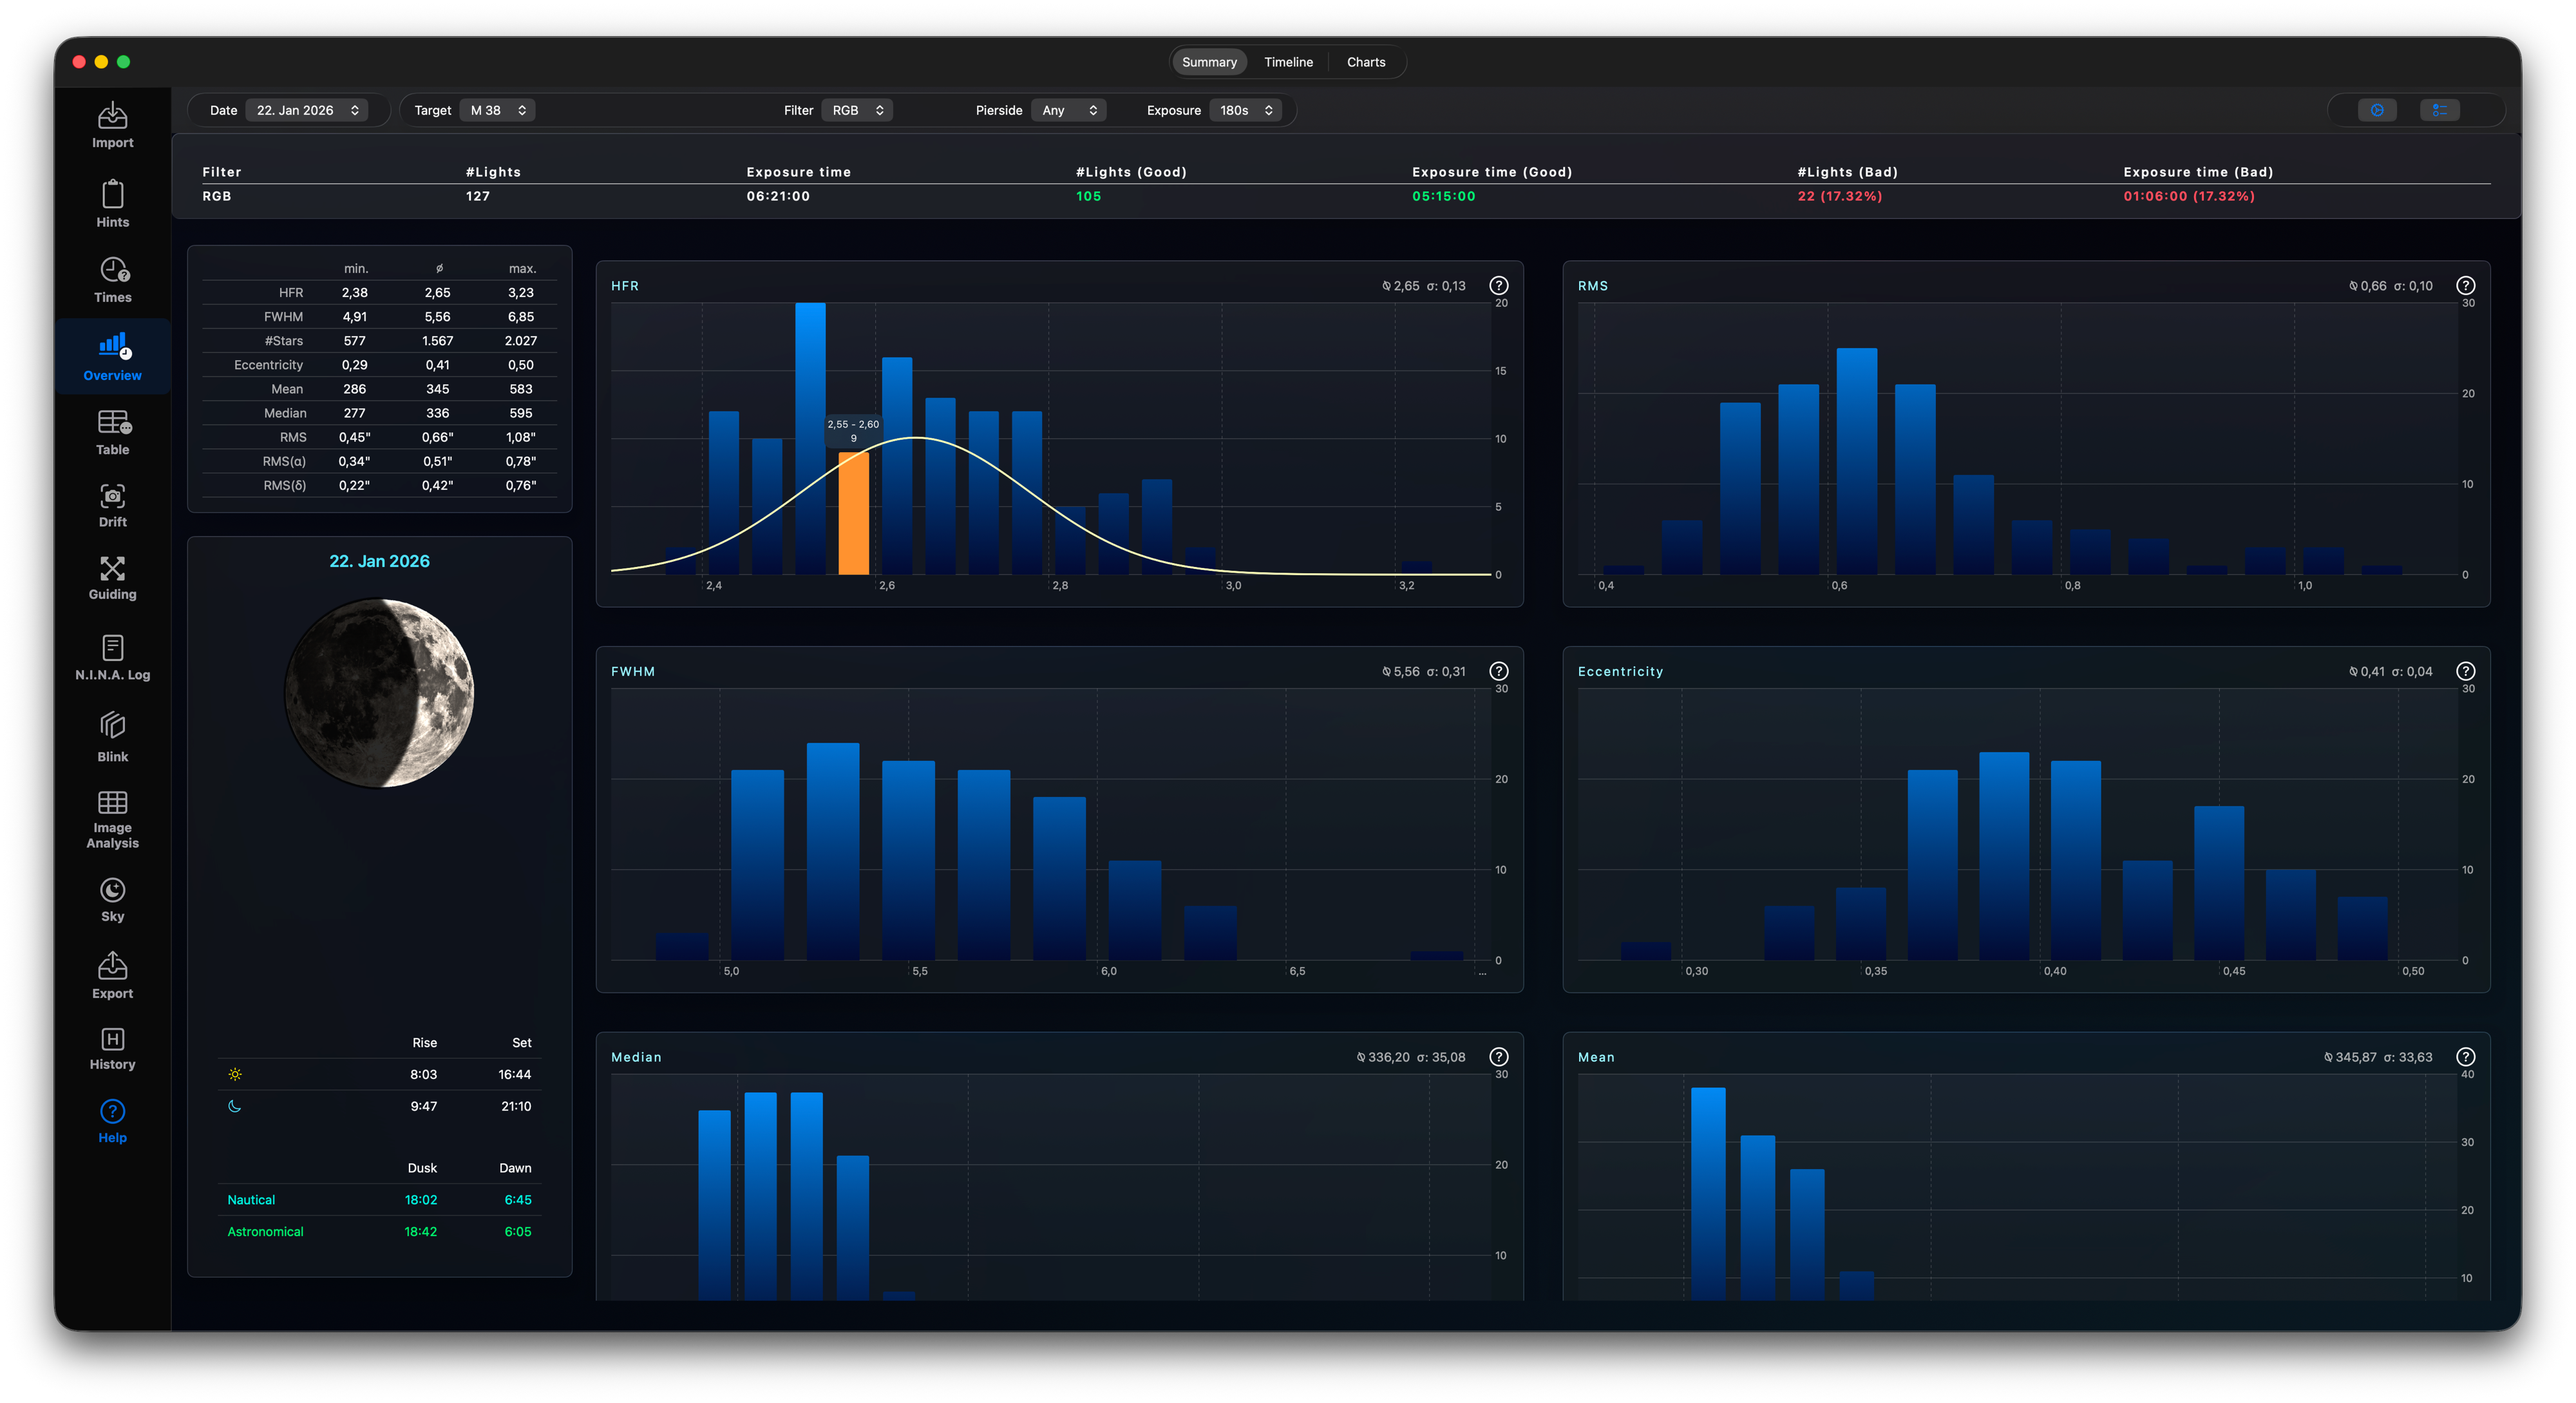
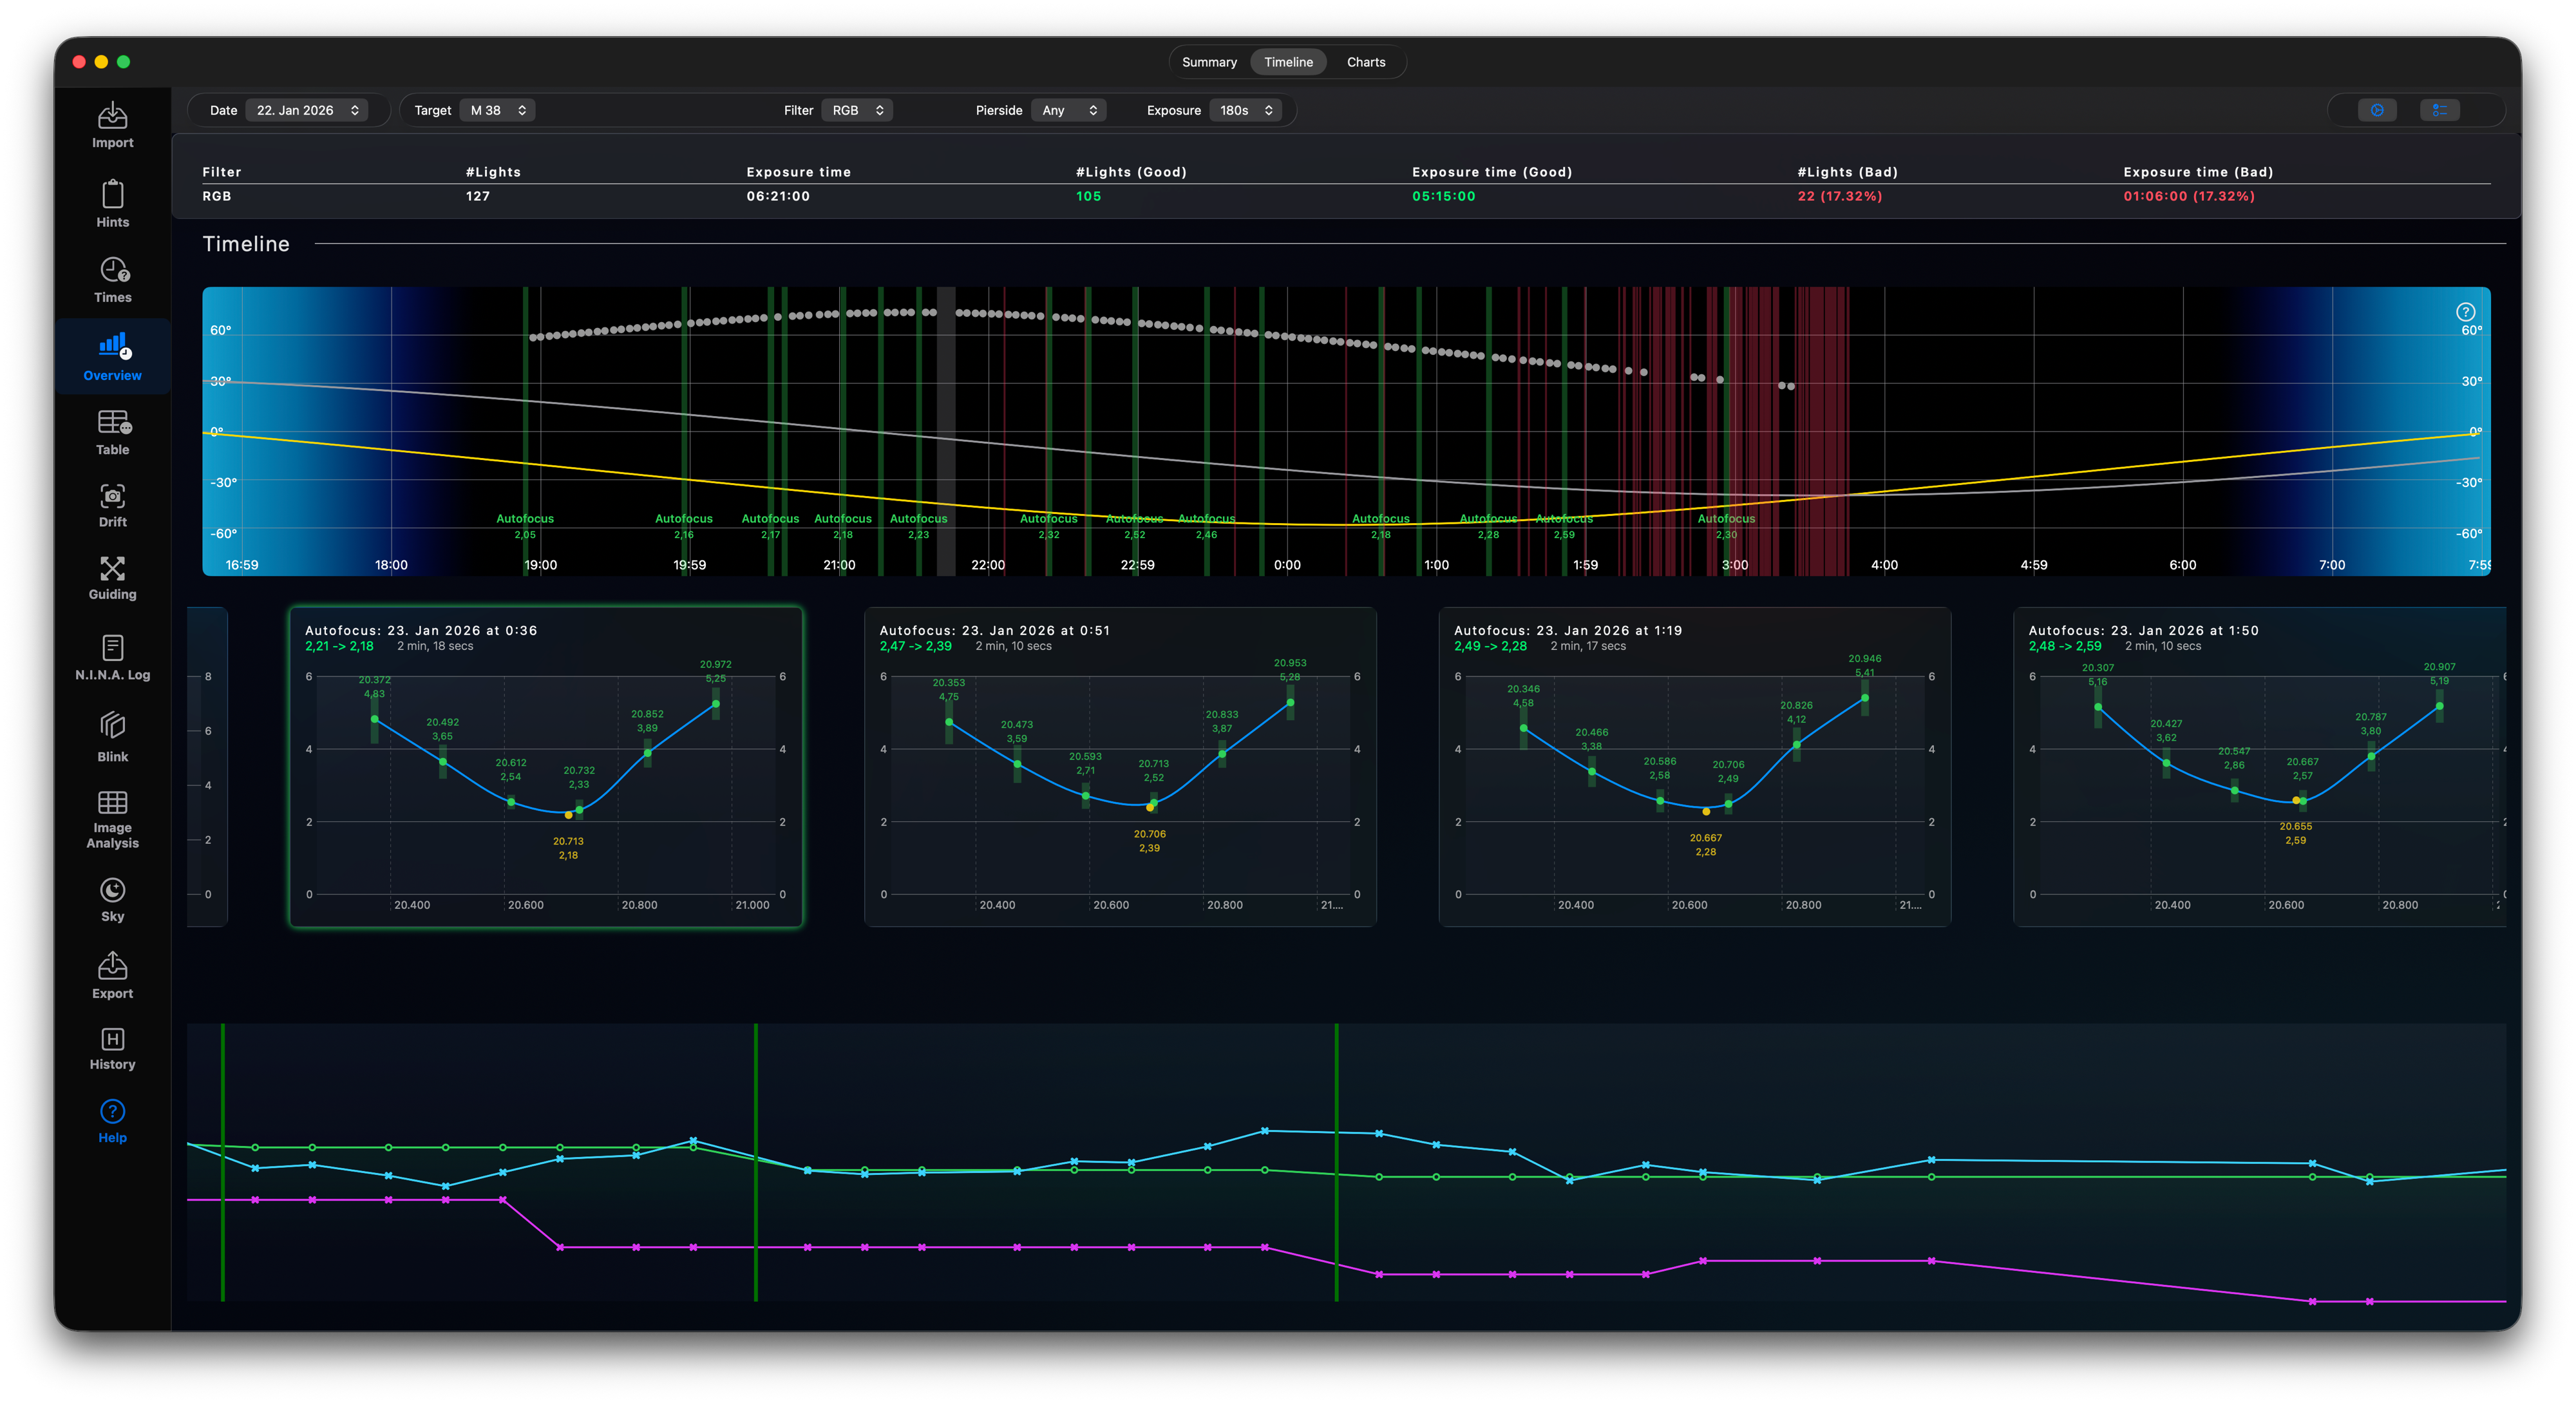
Inspect your autofocus runs. Are these runs always successful? Do they really affect the image quality or are they just a waste of imaging time, because you are running autofocus to often?
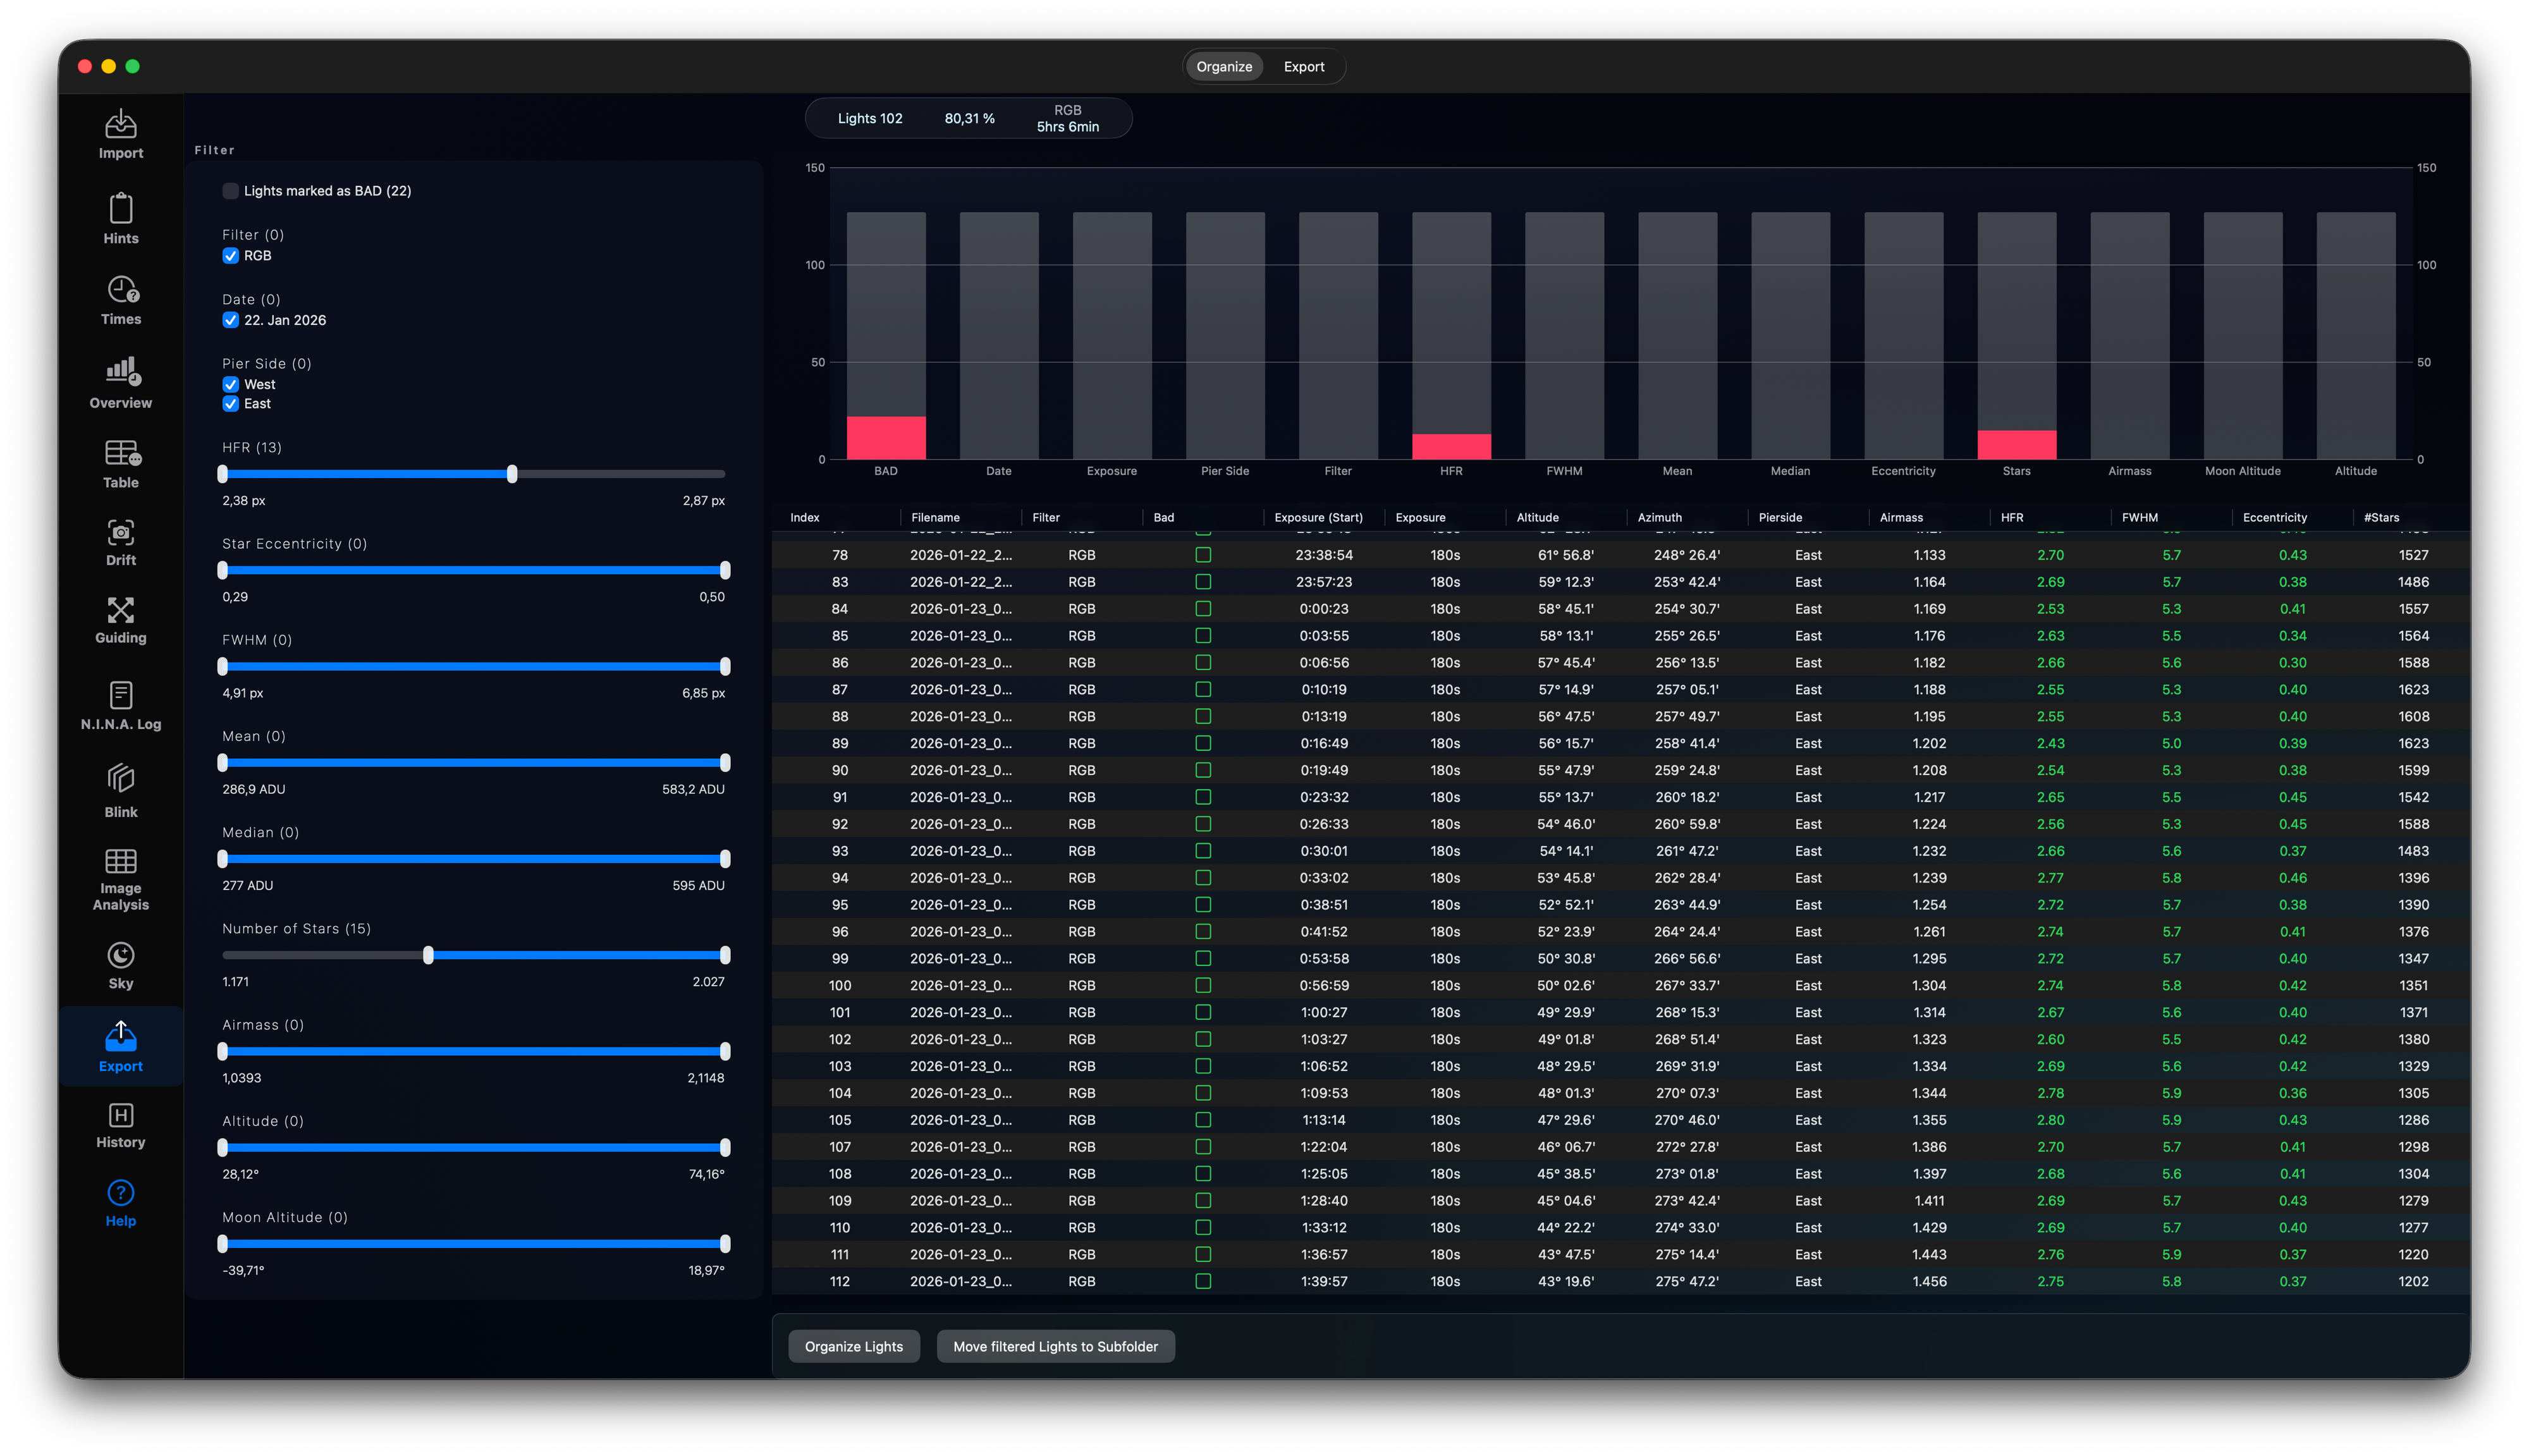
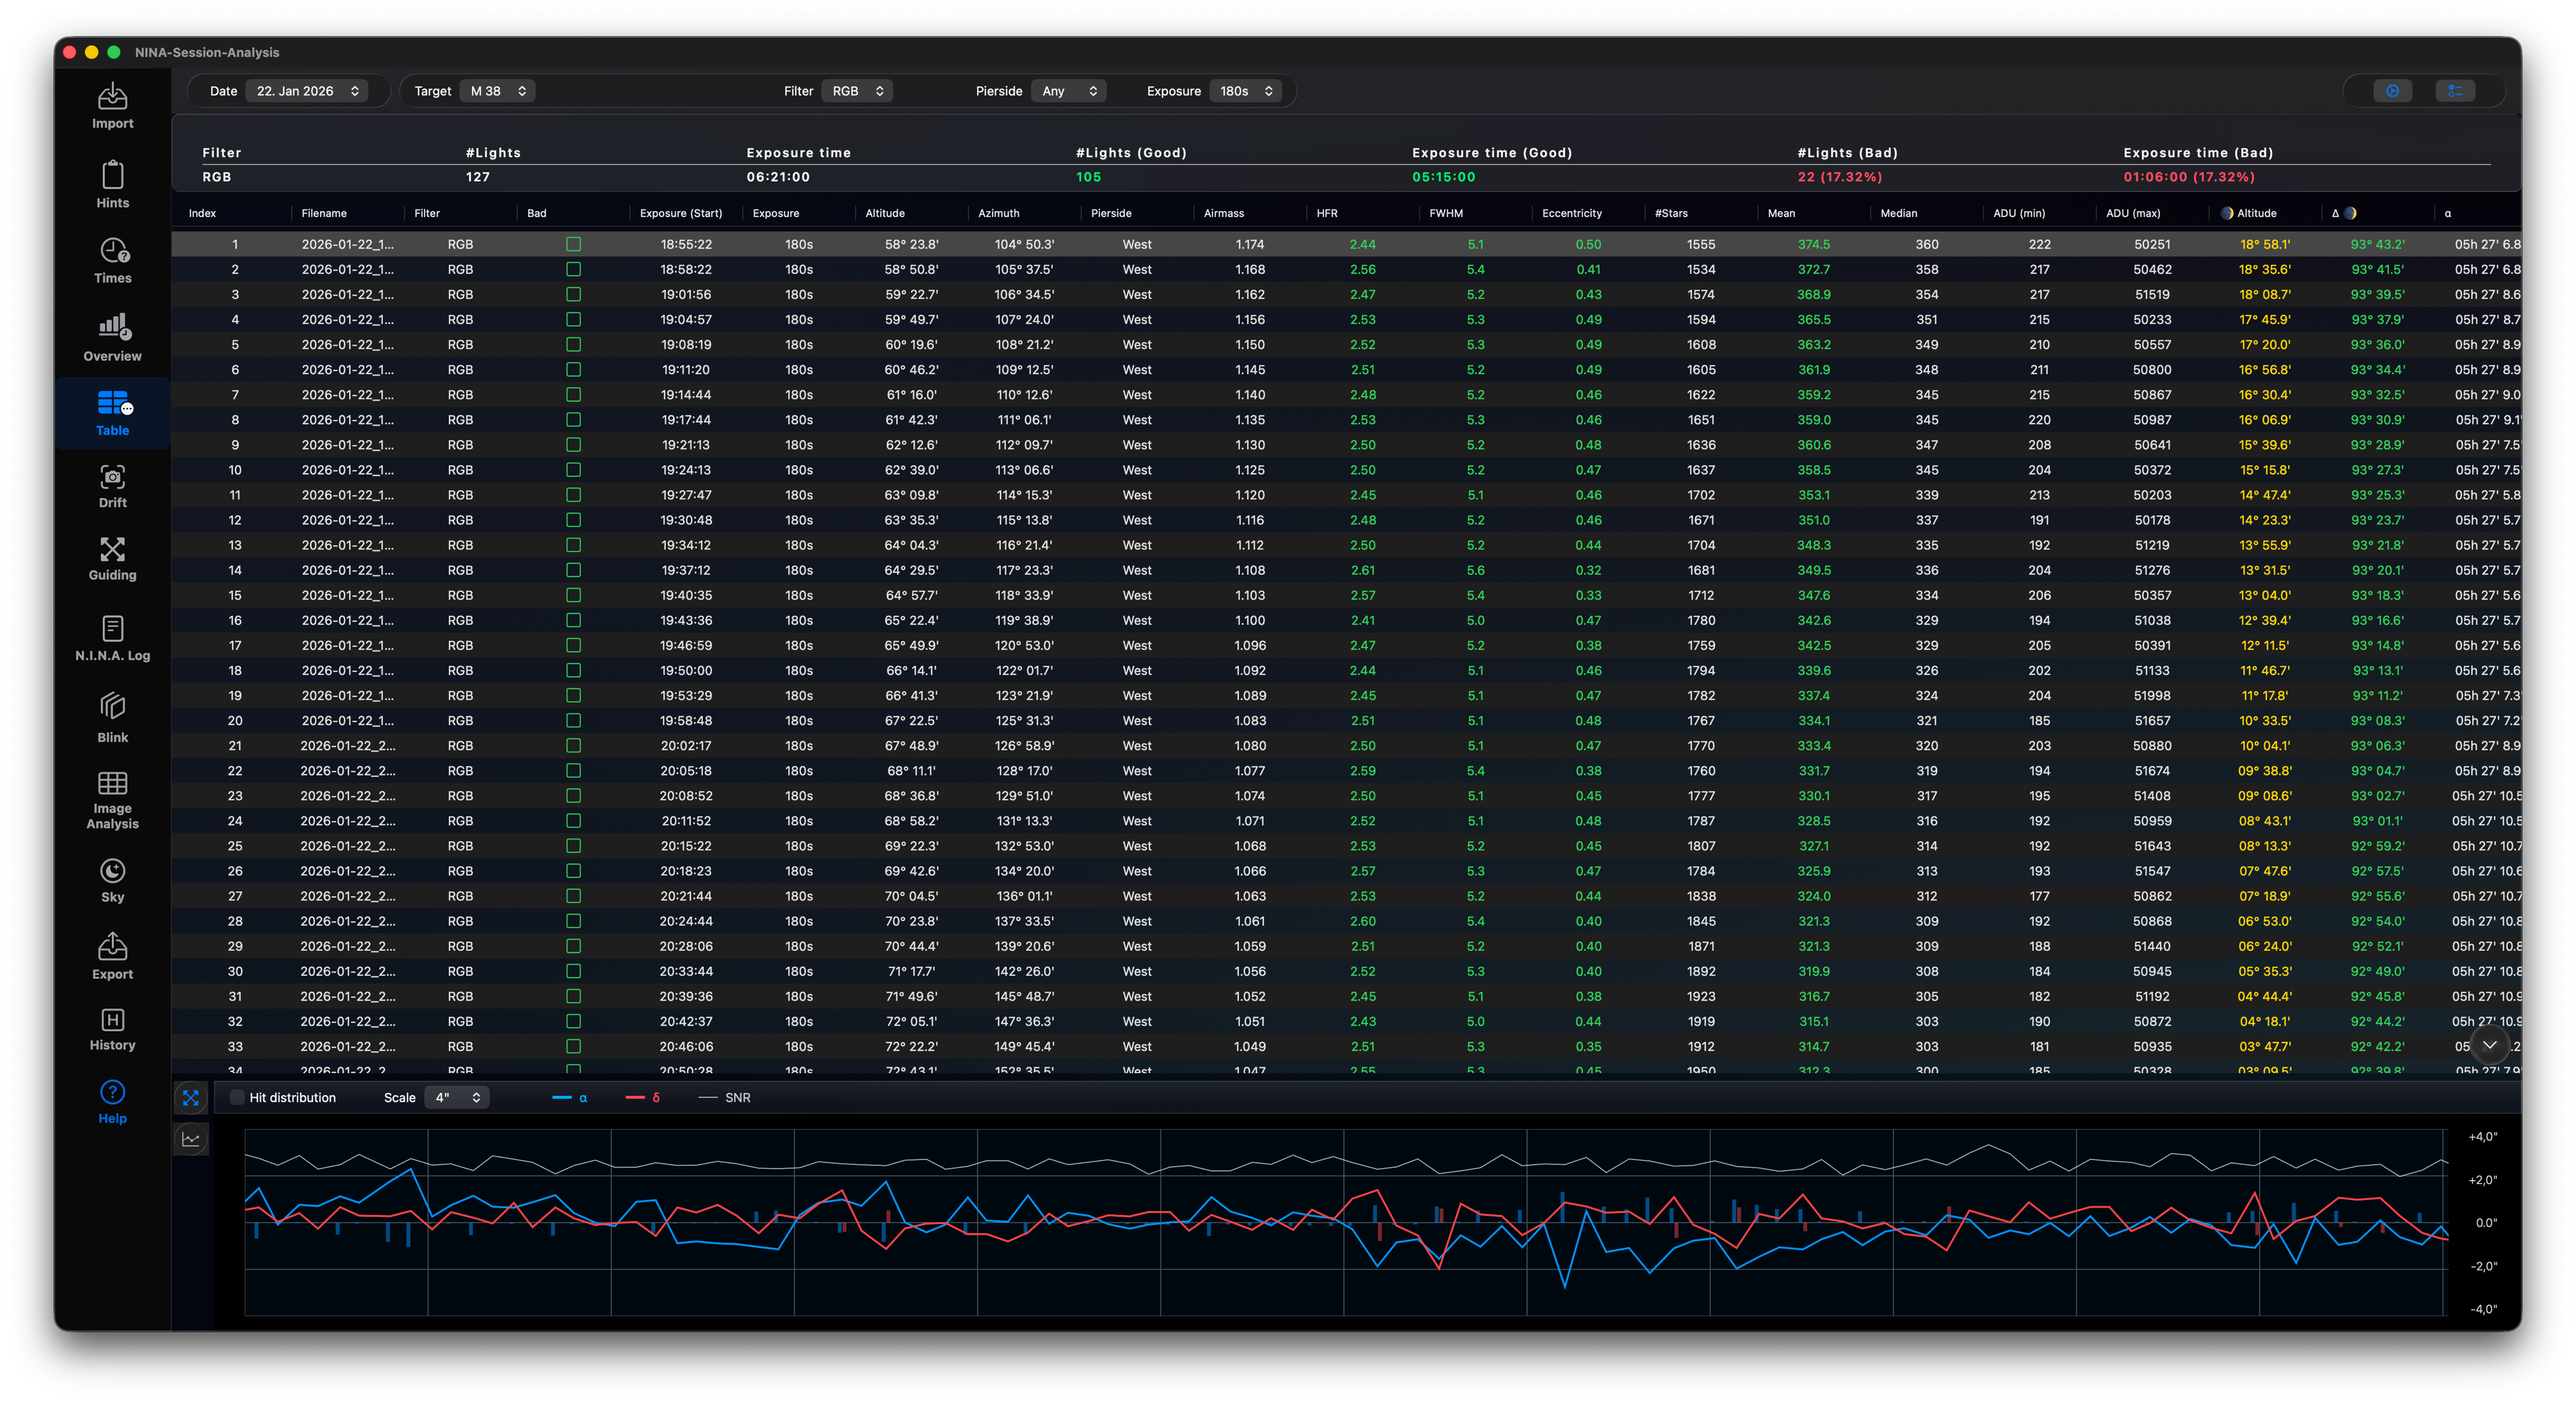
You can inspect all the data for each image by table. If there are too many values, don’t worry - you can select all columns to be shown. Marking an image as „Bad“ will rename the image file with „BAD“ as prefix the same way N.I.N.A. does. The rulers in the Data screen define which values will be shown as red to give you a hint for bad data. When you select an image you will see the corresponding guide graph, so you can see, if the HFR value or Eccentricity value is based on bad guiding.
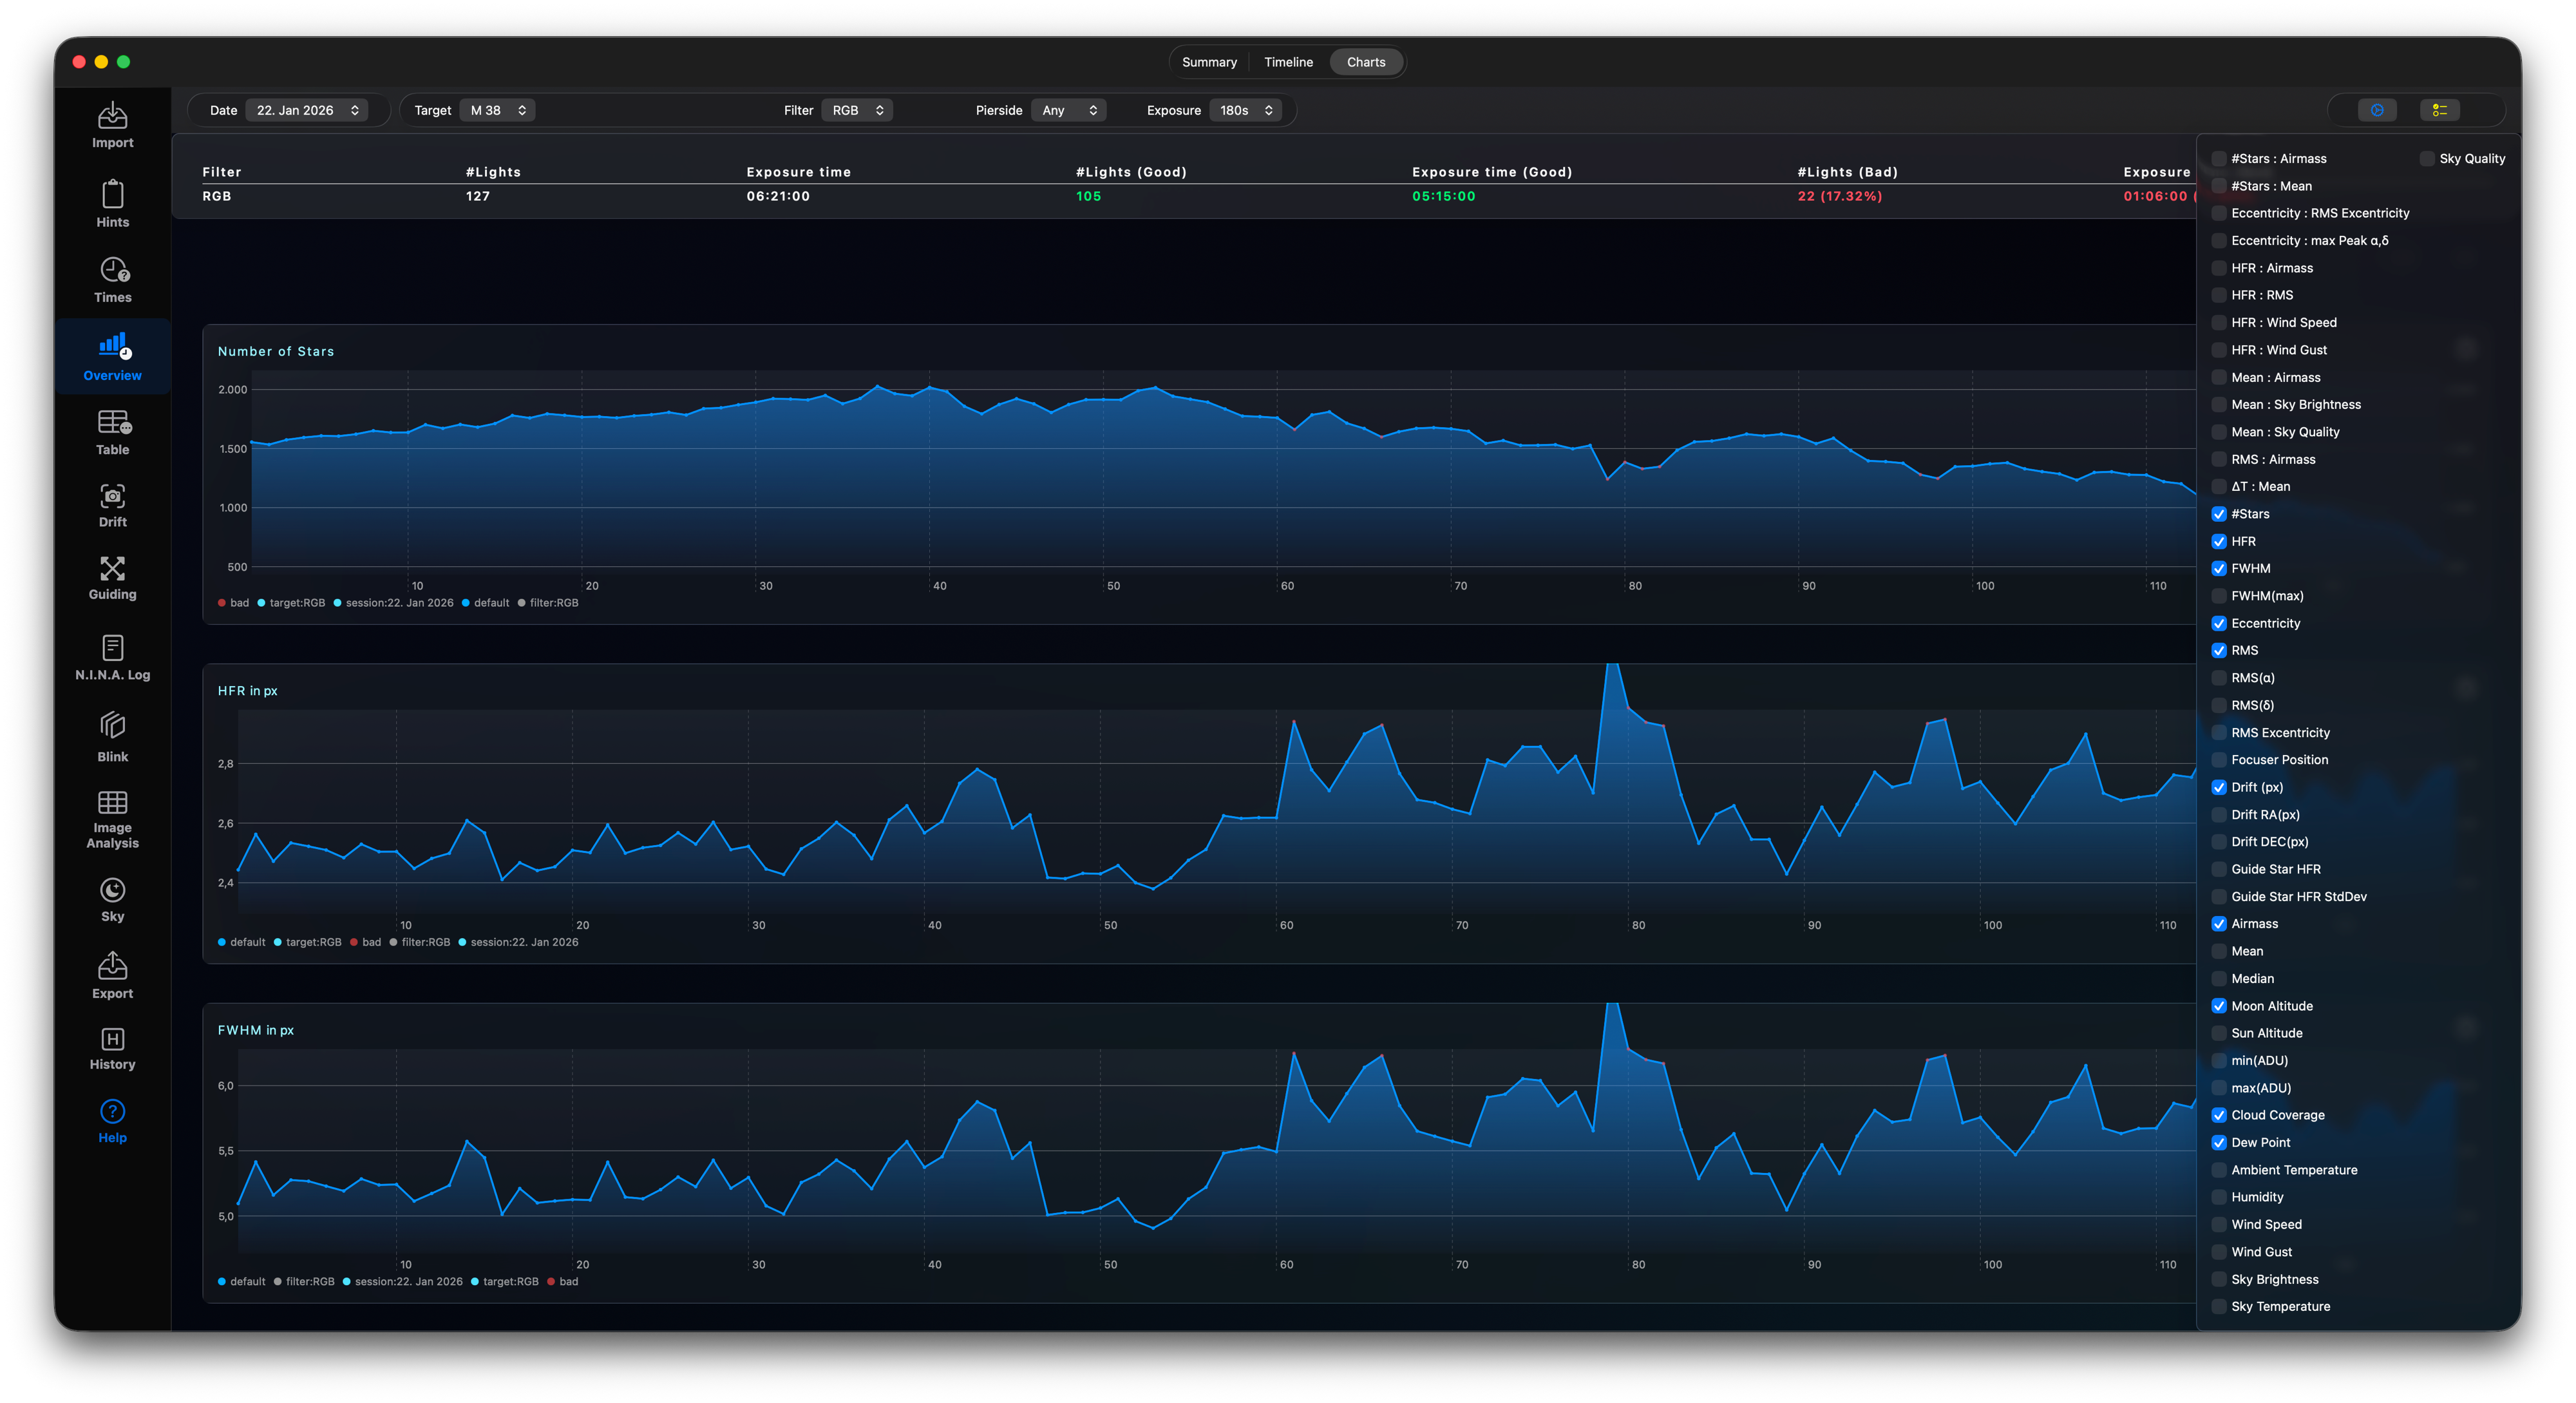
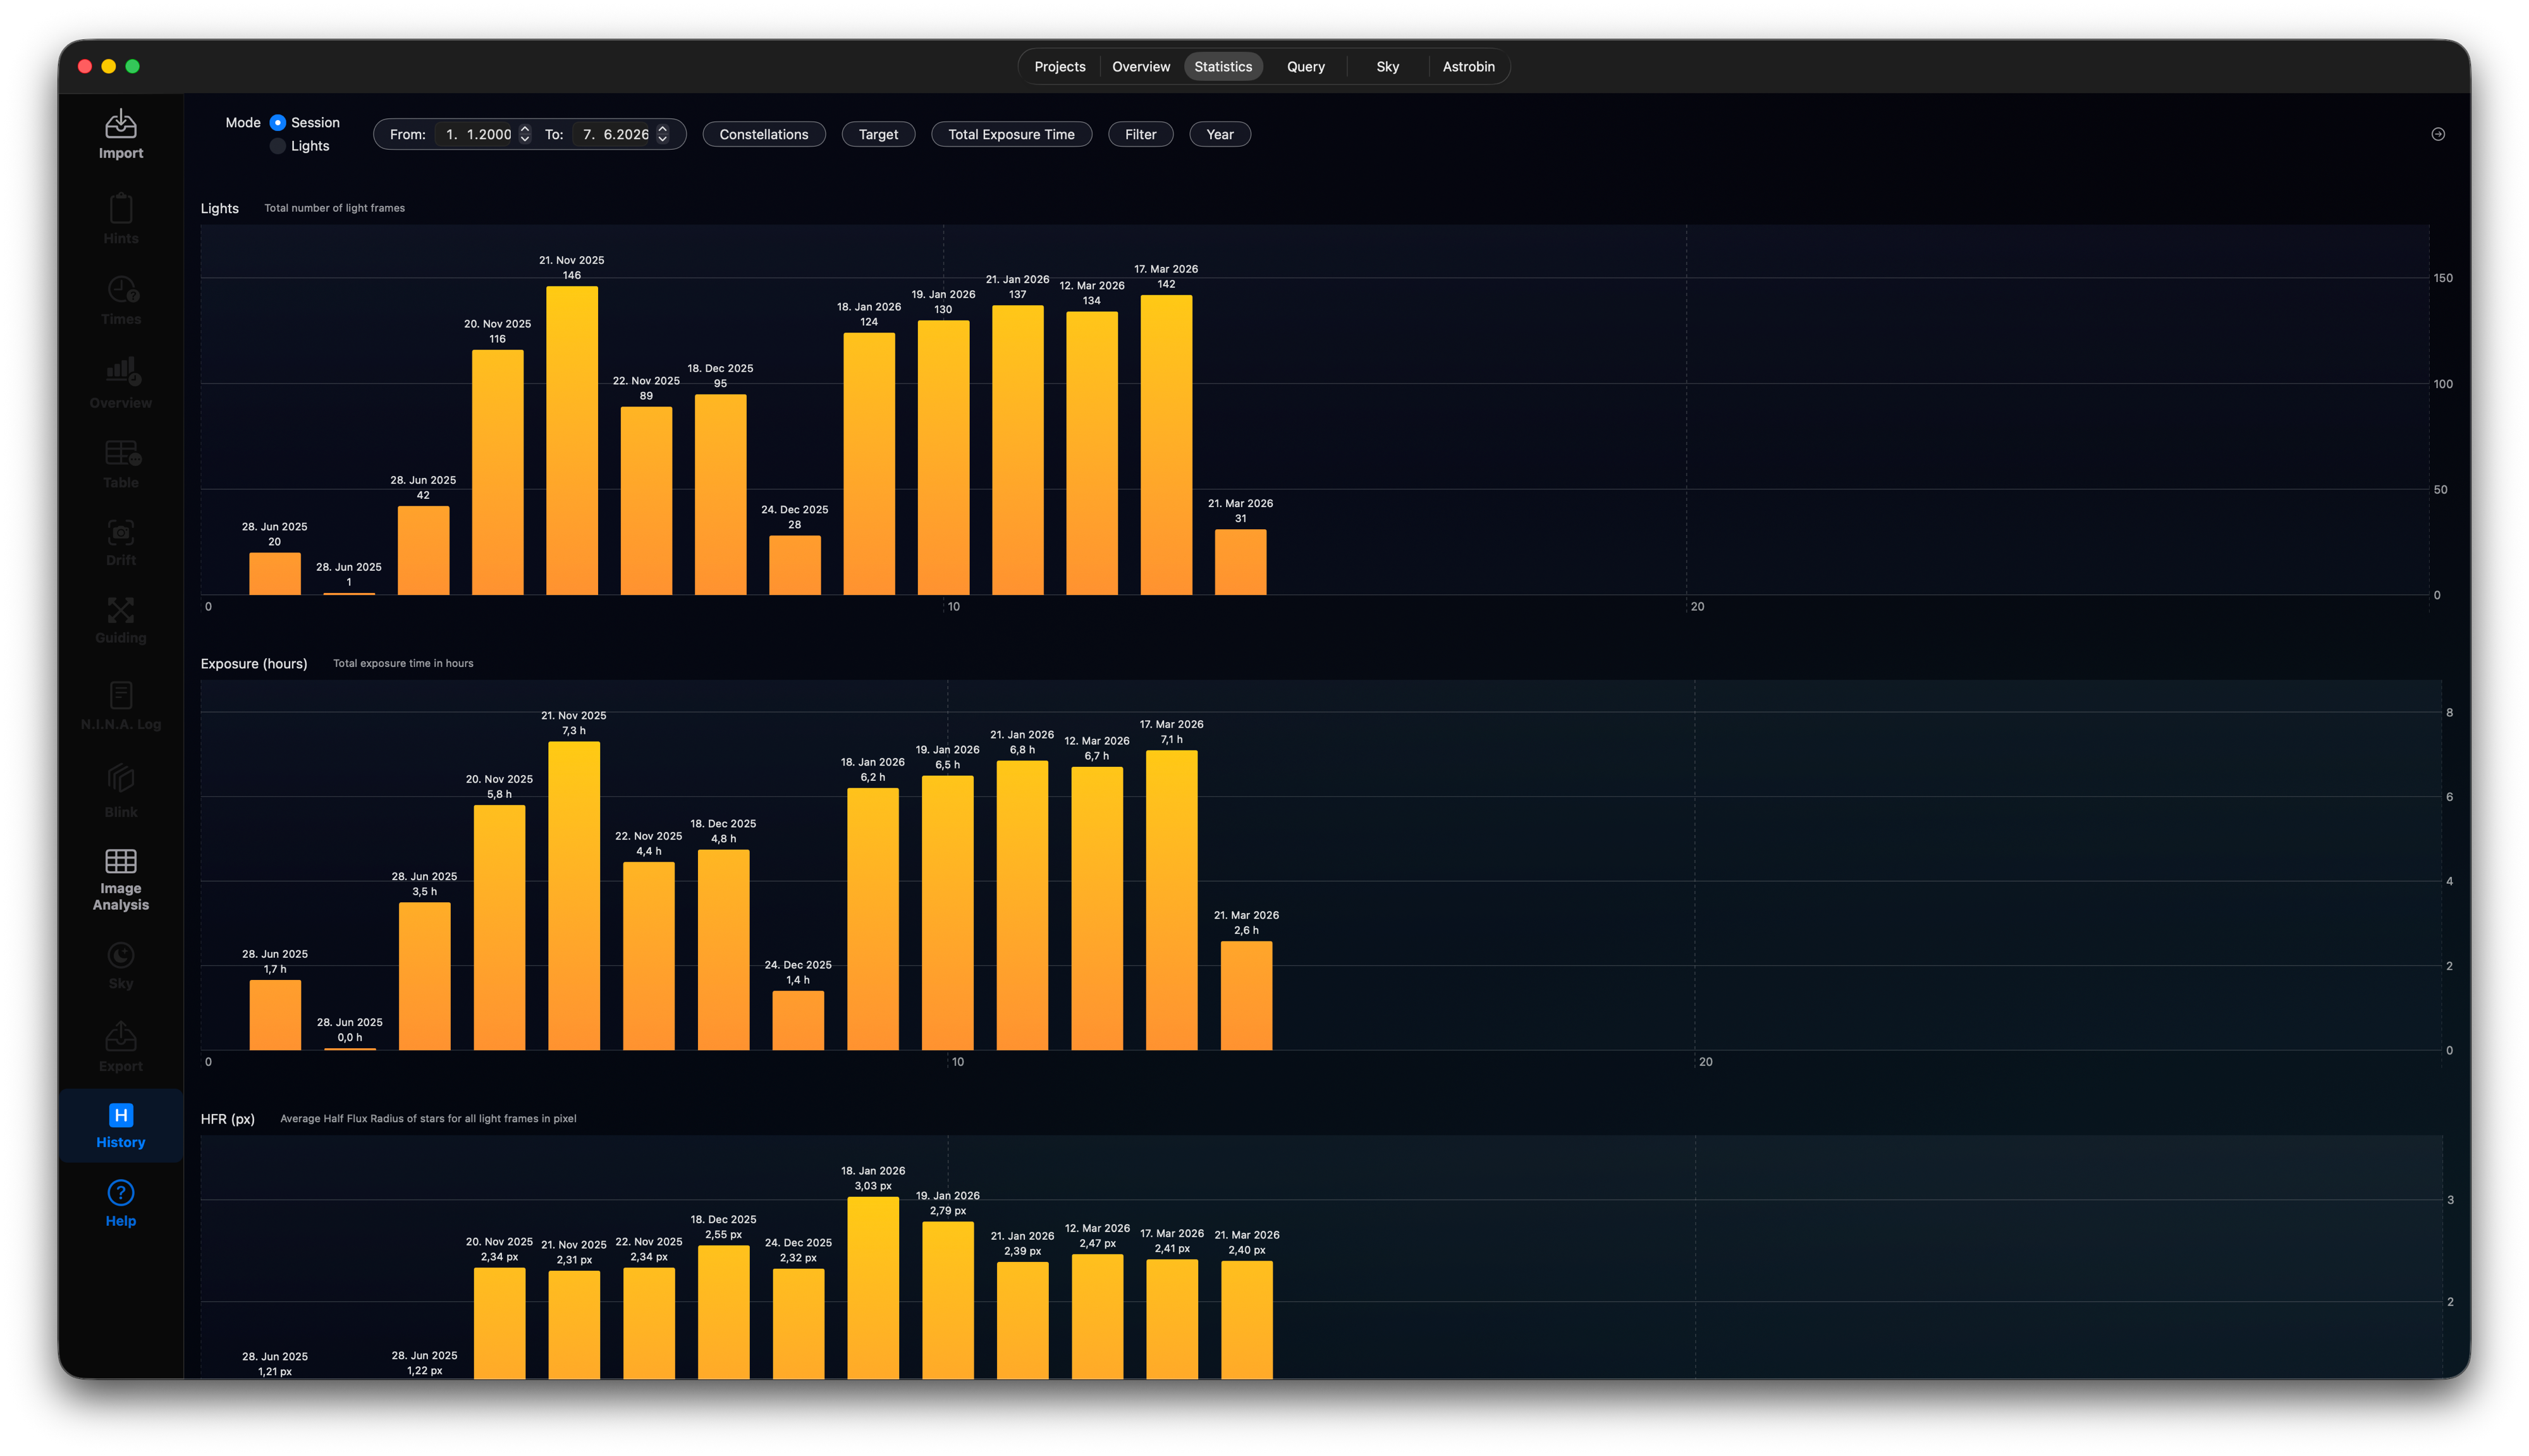
You can use the Charts tab to analyse all your data. If there is a chart missing for you, just select the value to be shown and find the new chart.
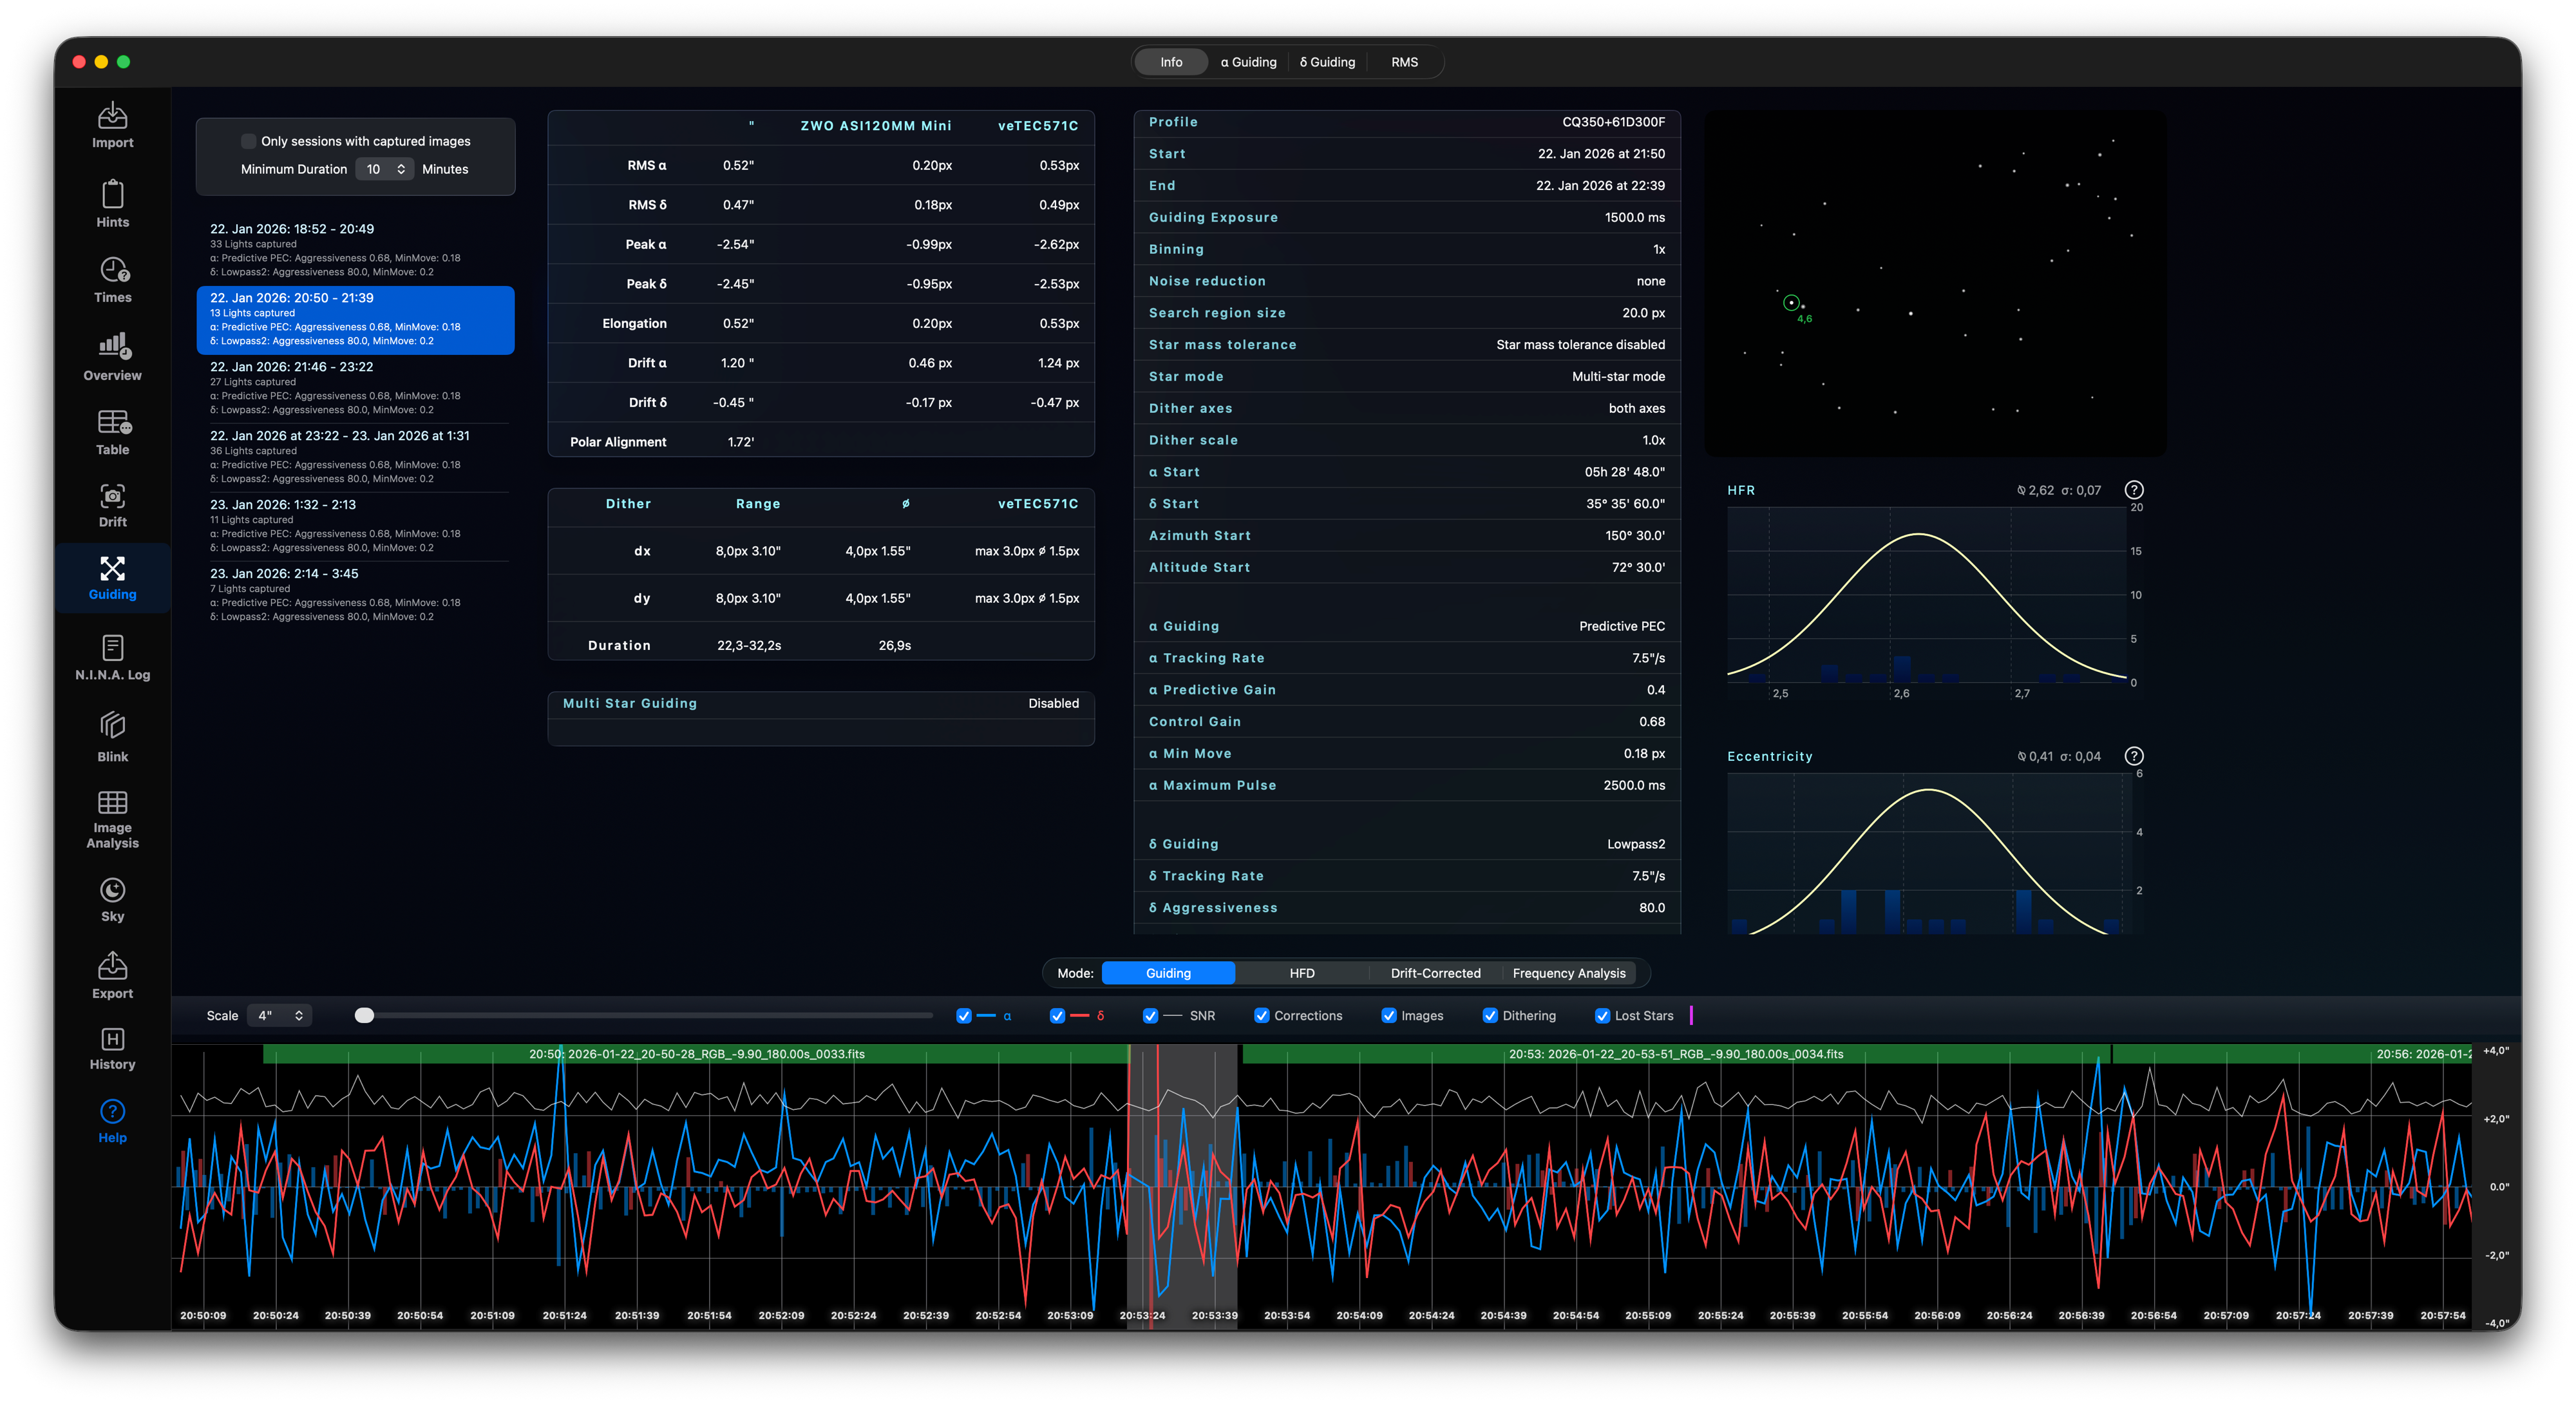
Inspect all aspects of your guiding. See, if you mount was well-balanced or not and which guide star was selected.
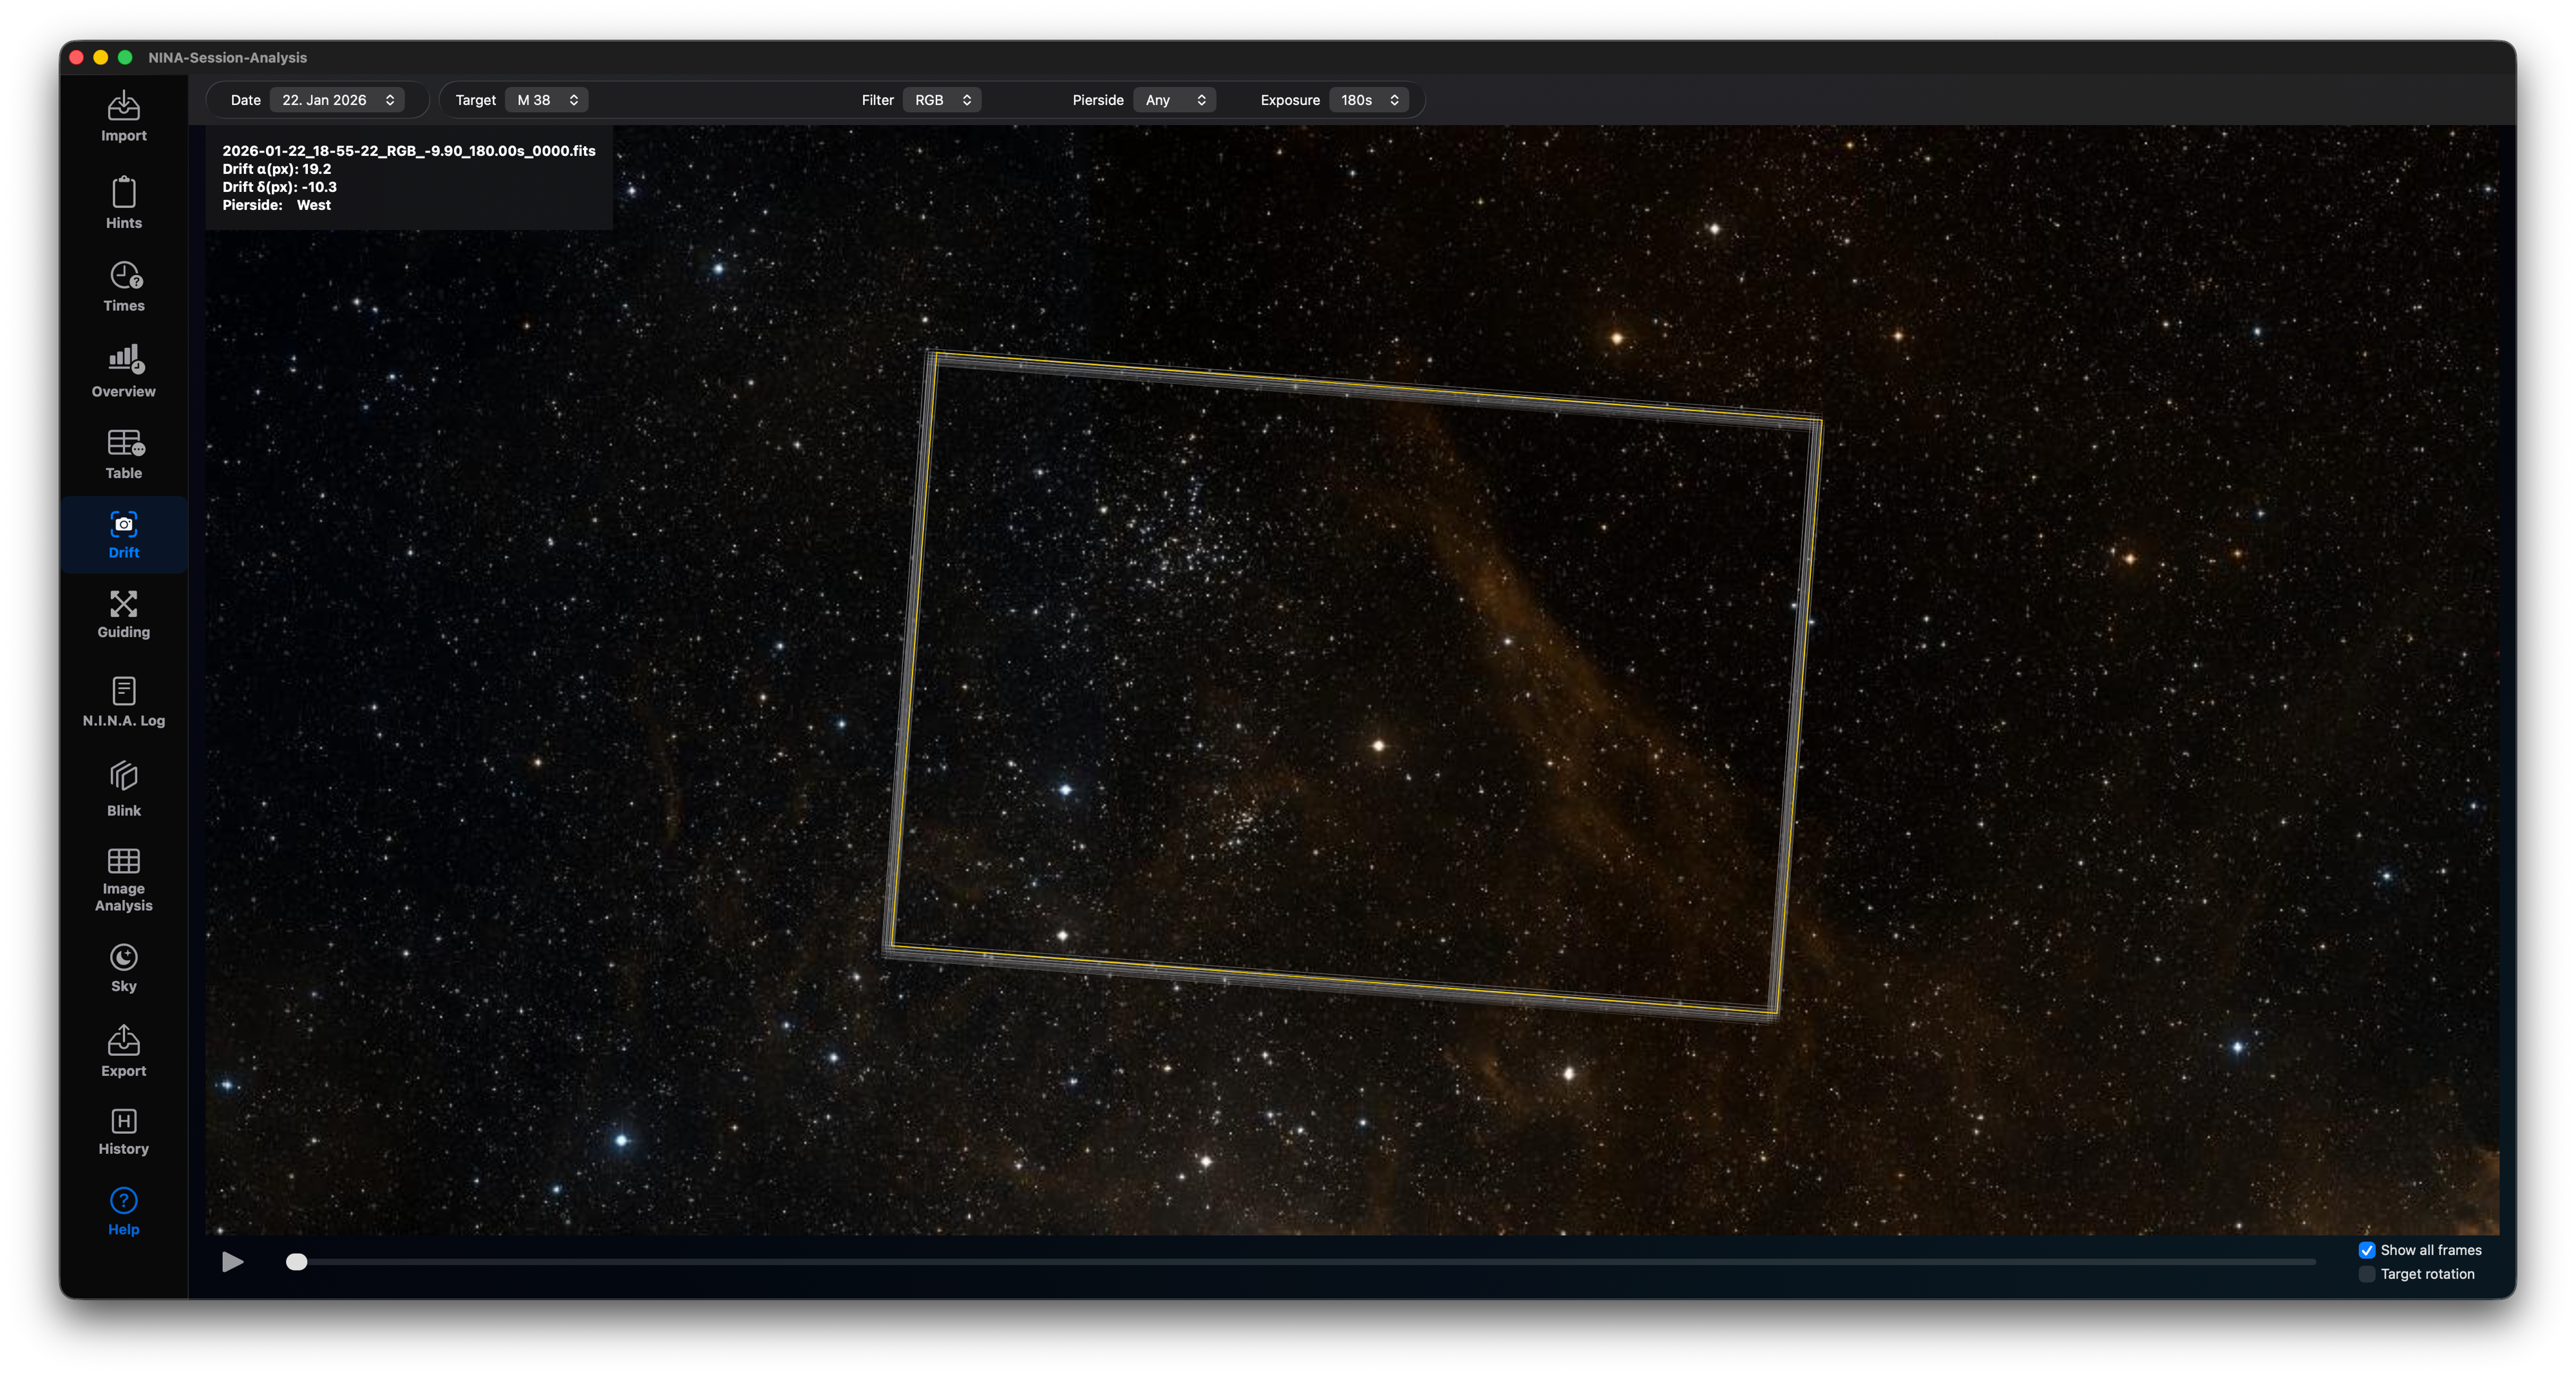
Ever wanted to see how good your dithering works? Here it goes! The drift panel shows all your captured imaging frames, so you can see the effects of dithering, but also drifted images, Animate this screen to see how your session worked and if the dithering was configured well enough.
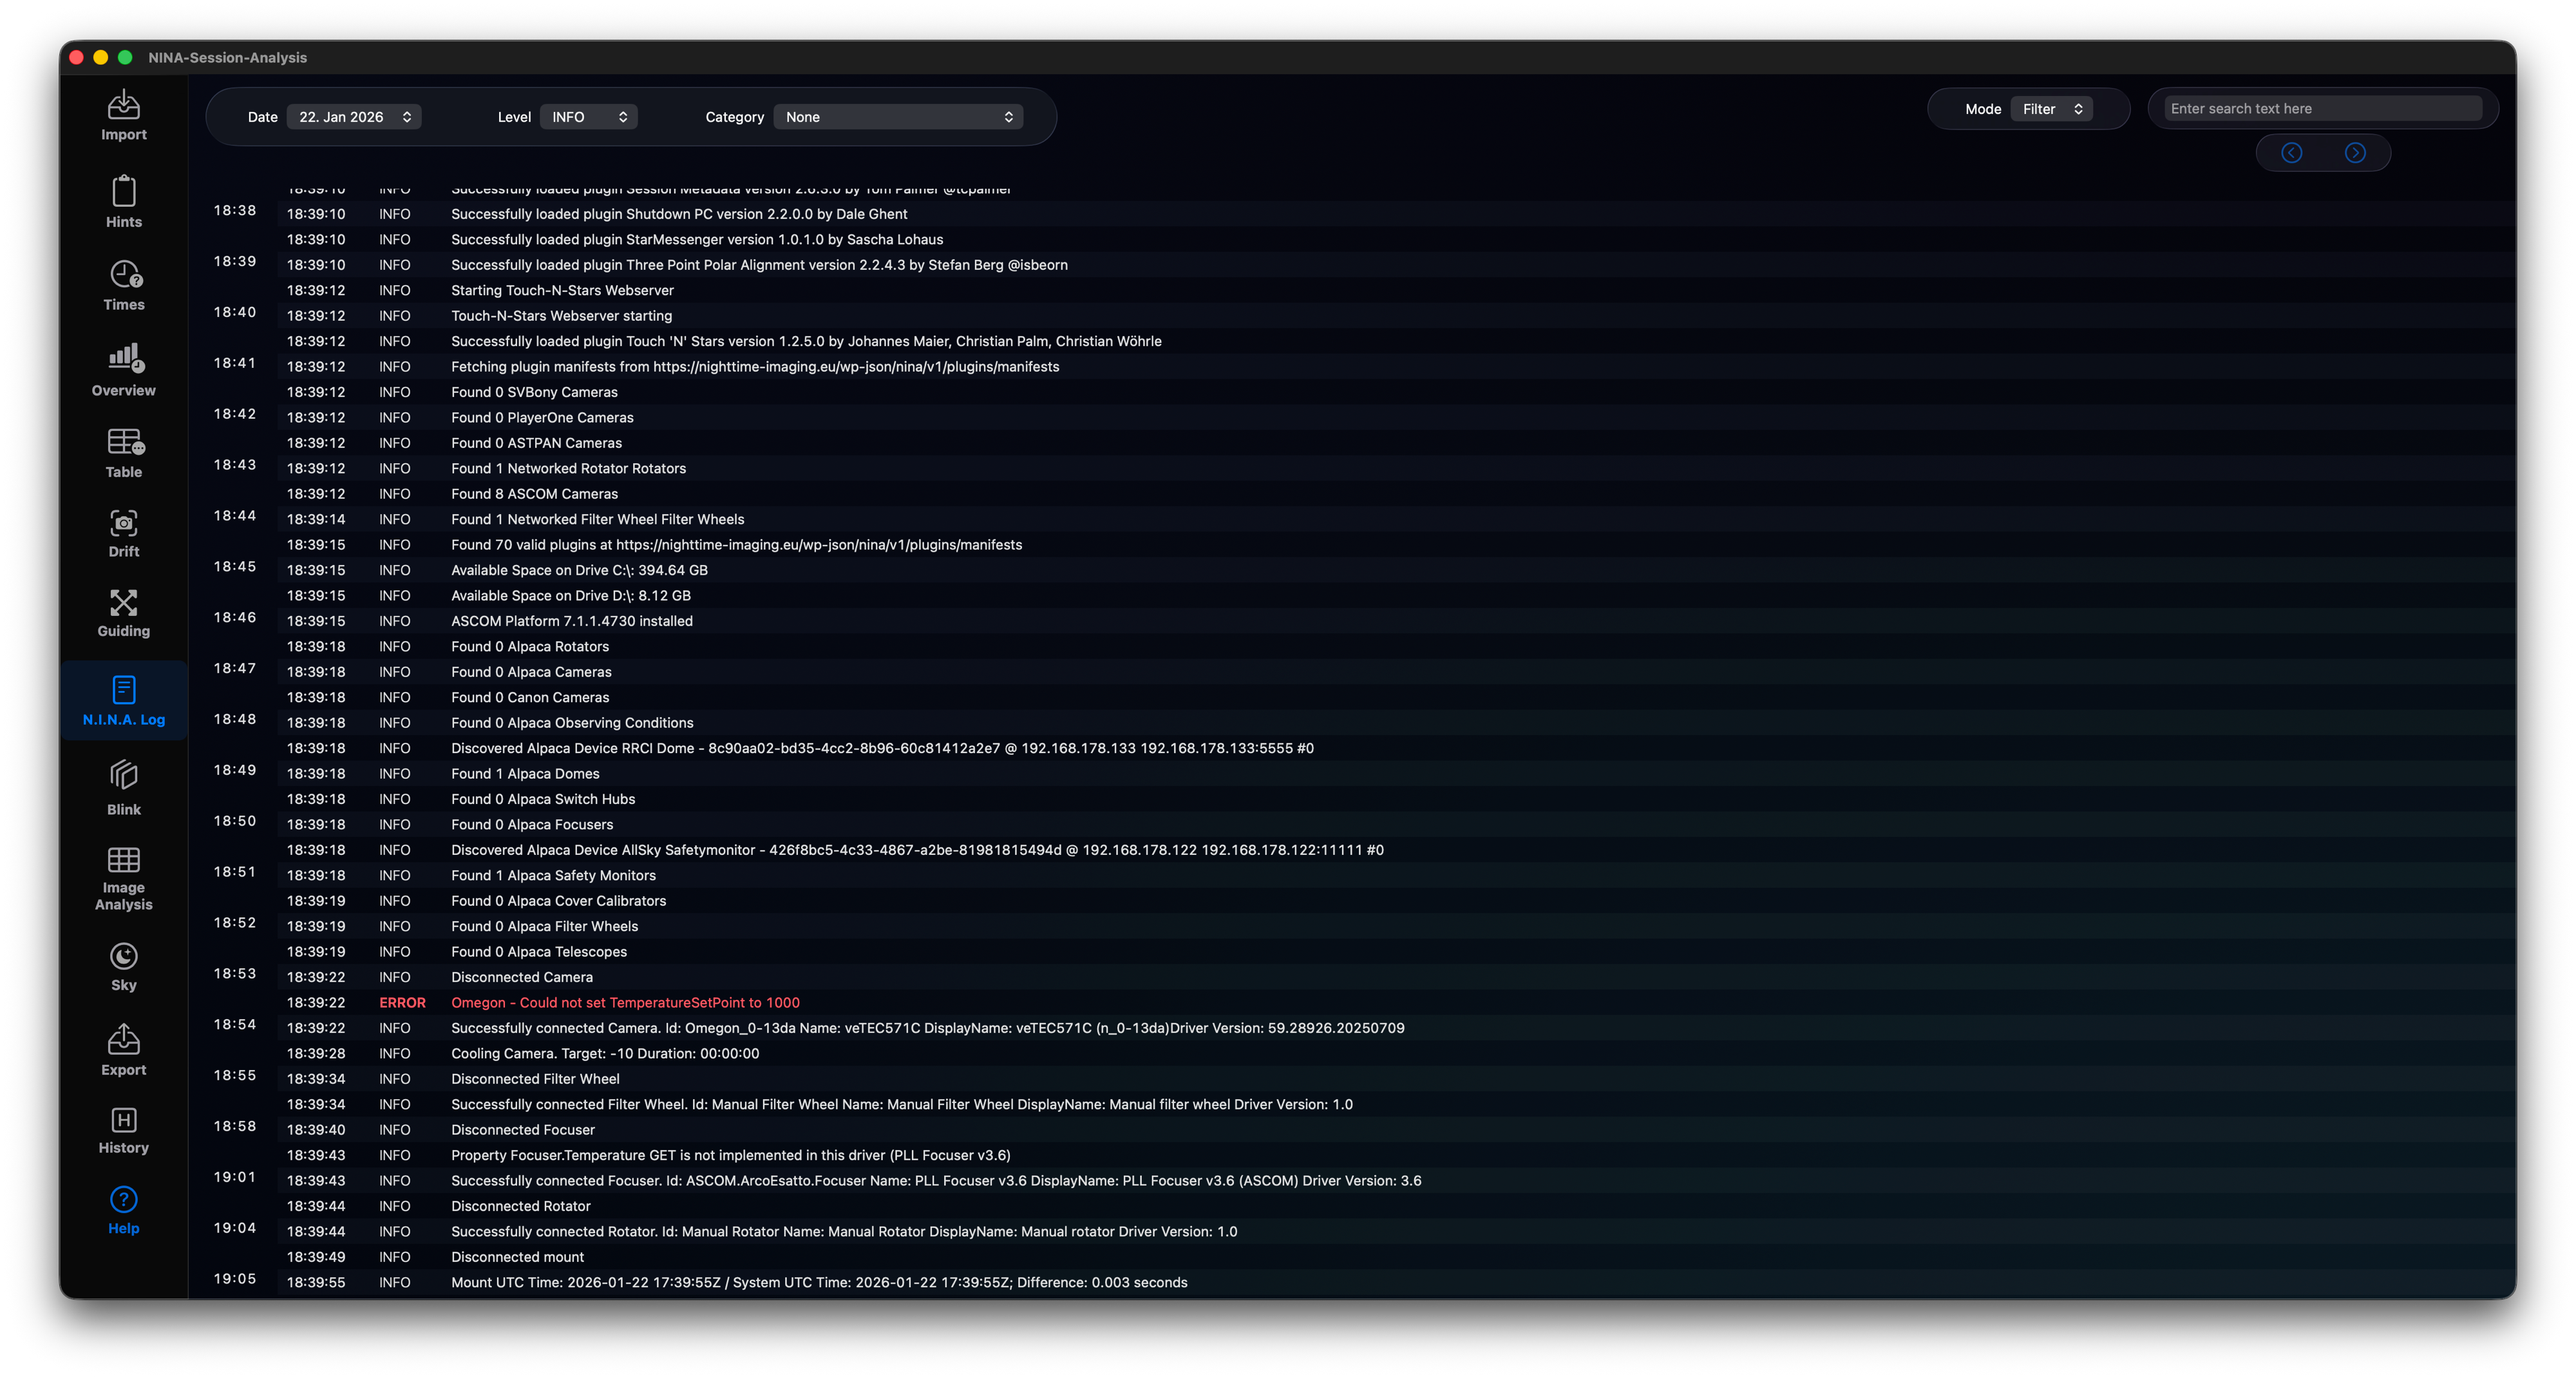
Have a look inside the N.I.N.A log file. You can search for a special word inside the log and use the timeline bar on the left-hand side to jump to each hit. Or you can select one of the found categories to see what’s happening while taking an exposure.
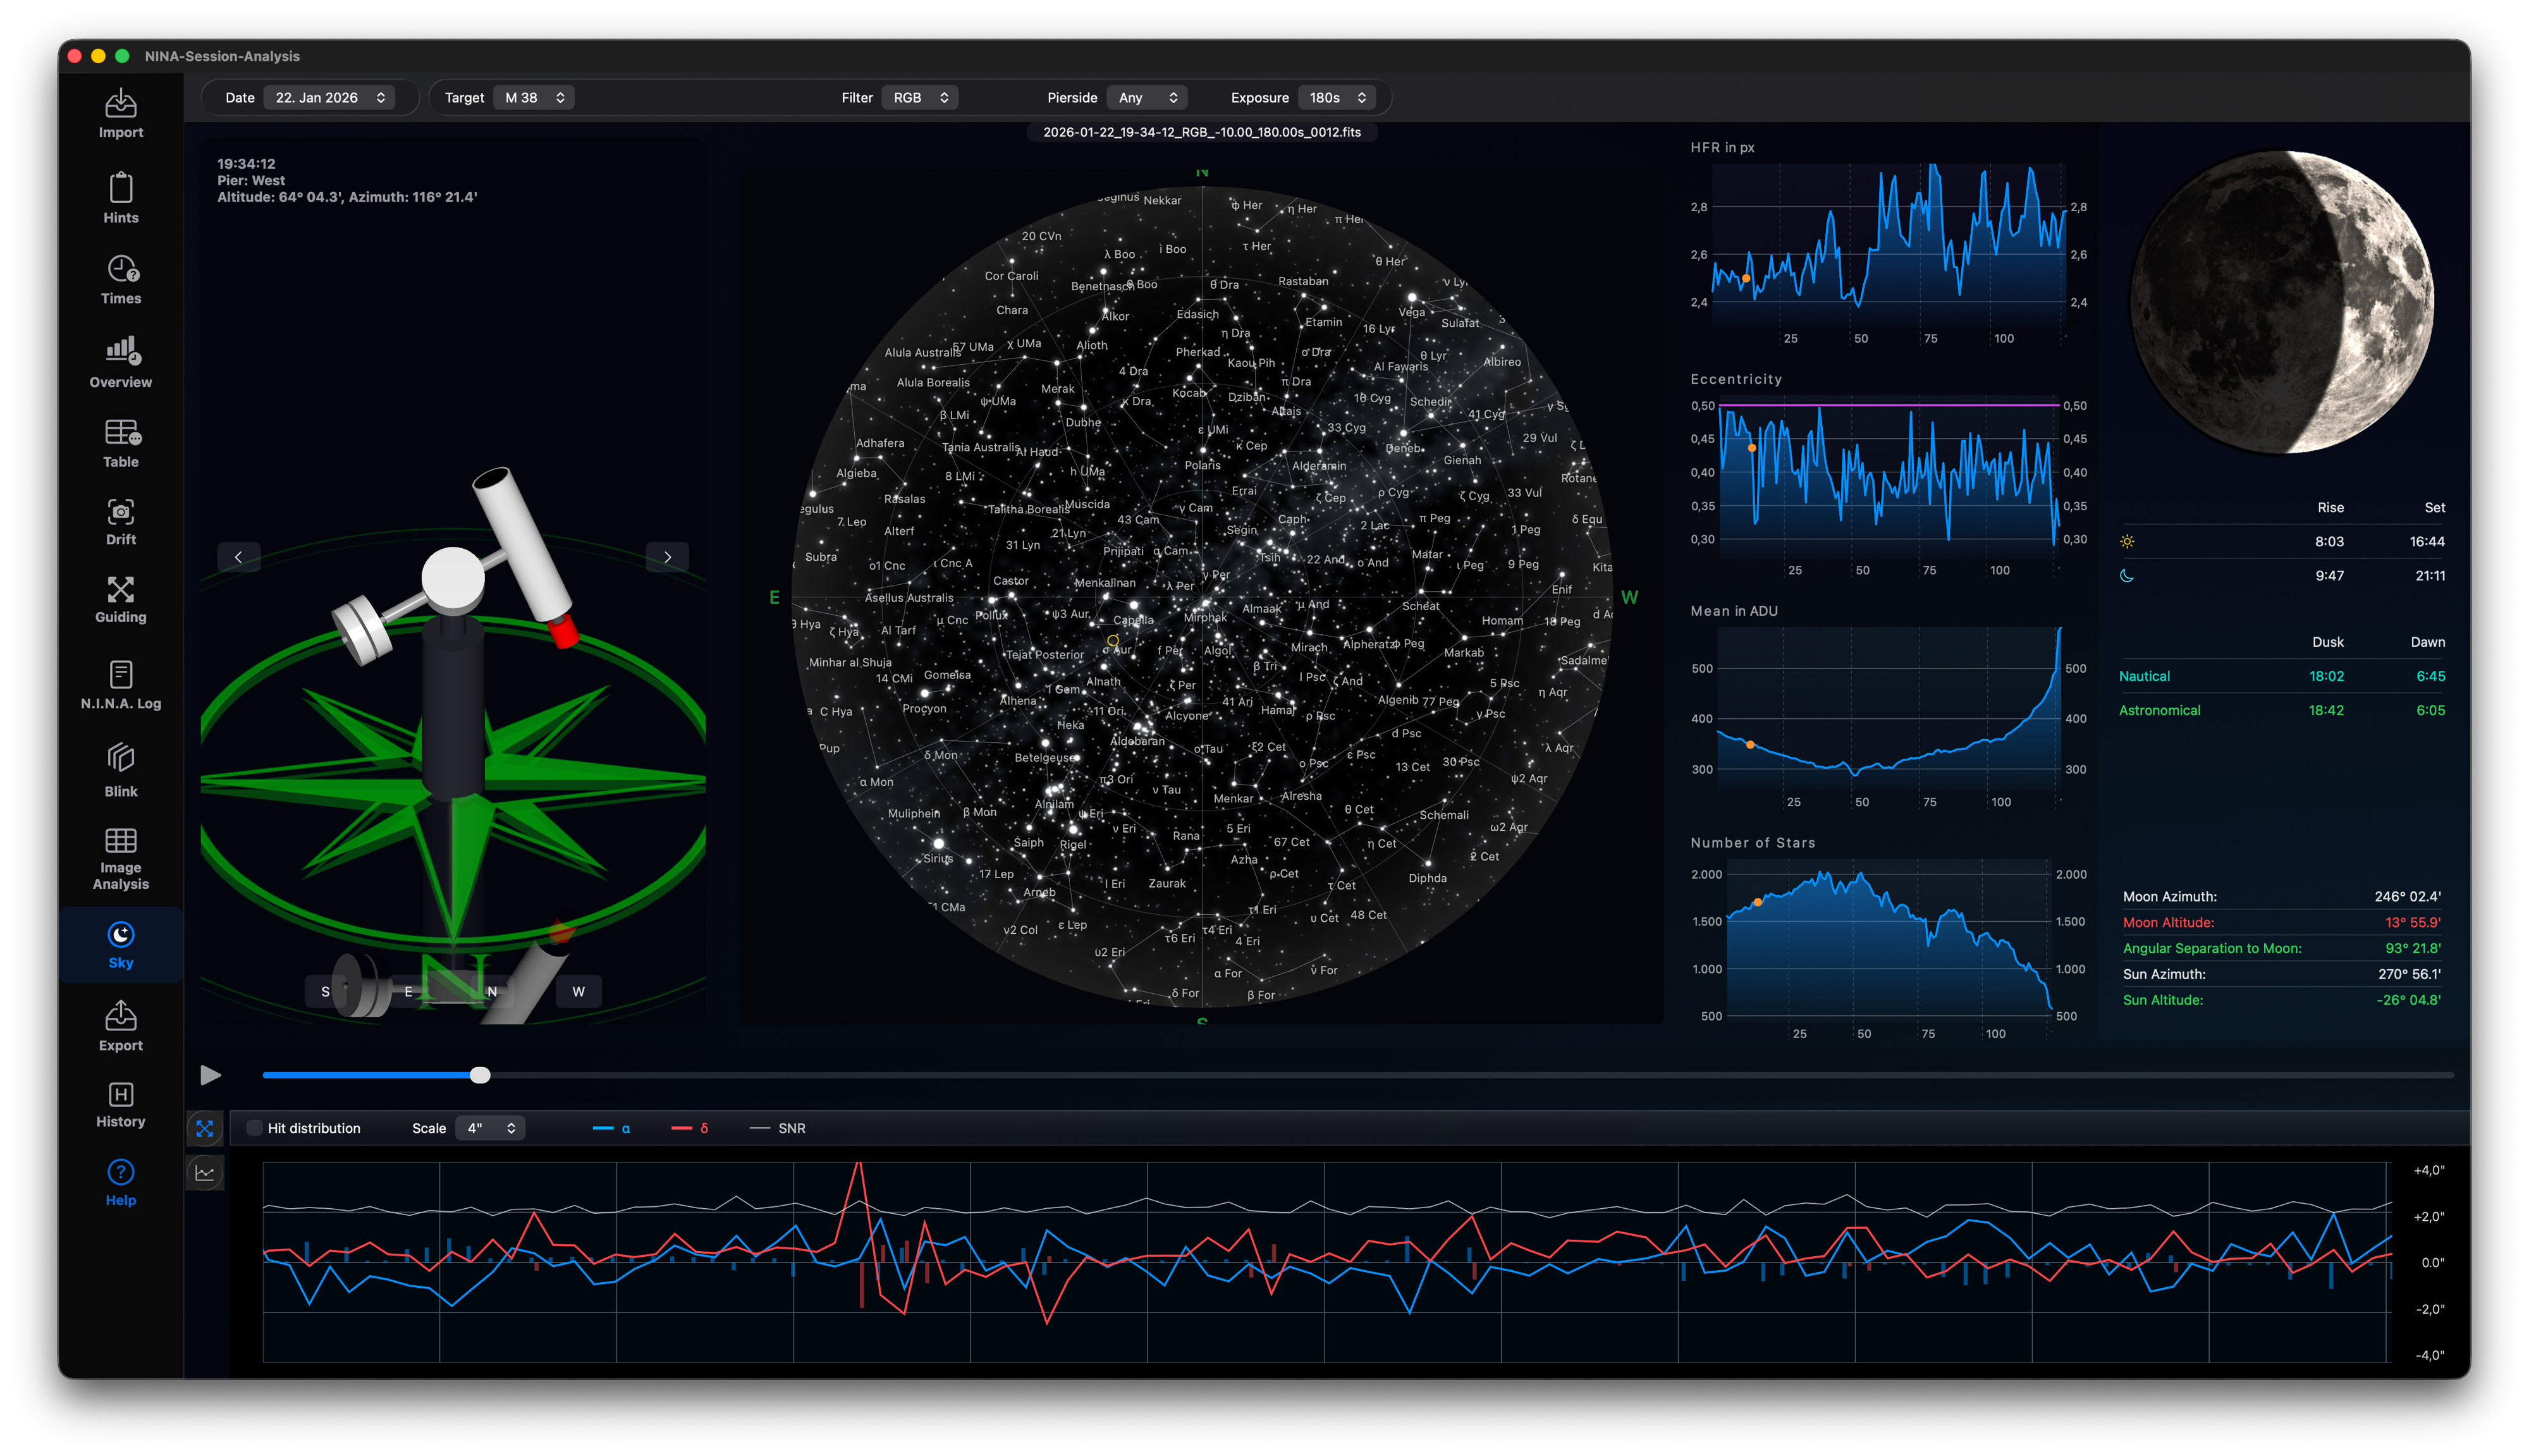
In the sky section you can see where your target was located on the sky during each exposure. You will see the guiding for this image and you will have all significant values available. This gives you a good overall impression about your session.
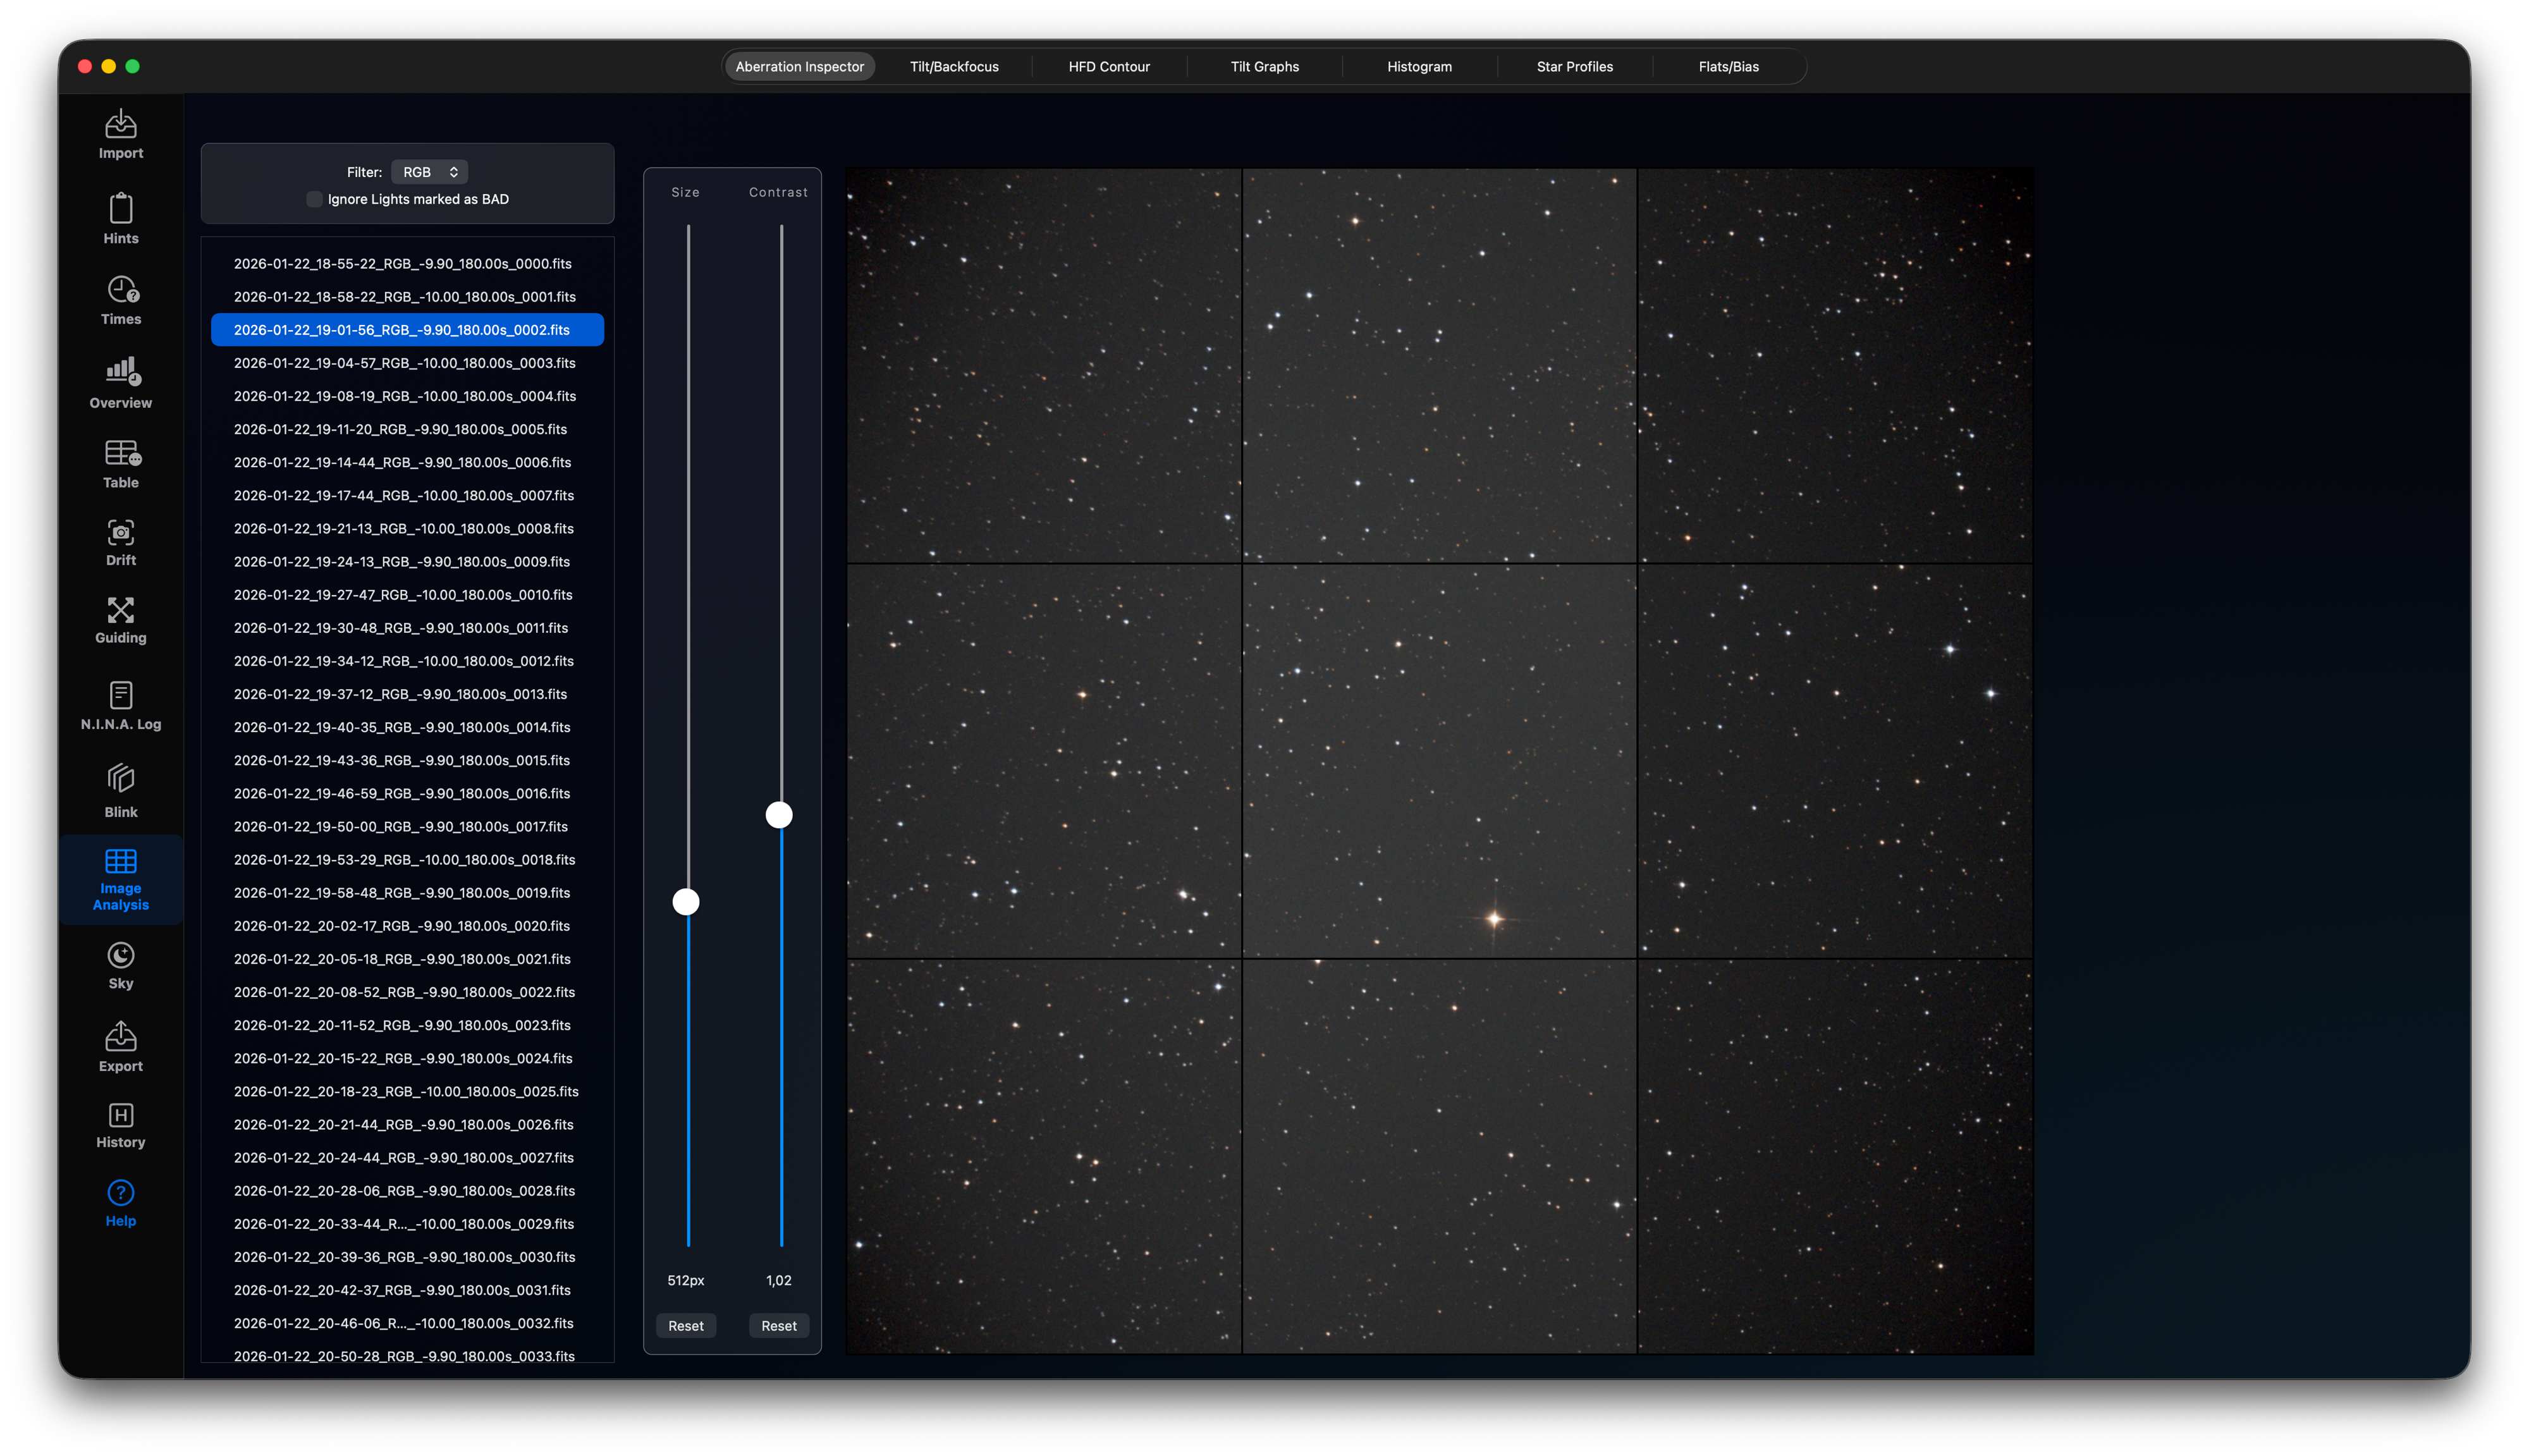
Use the Aberration Inspector to inspect the image corners. If all stars are elongated in the same direction you are facing some guiding issues. Otherwise, if the stars are elongated in different directions you will have a backfocus issue or some tilt.
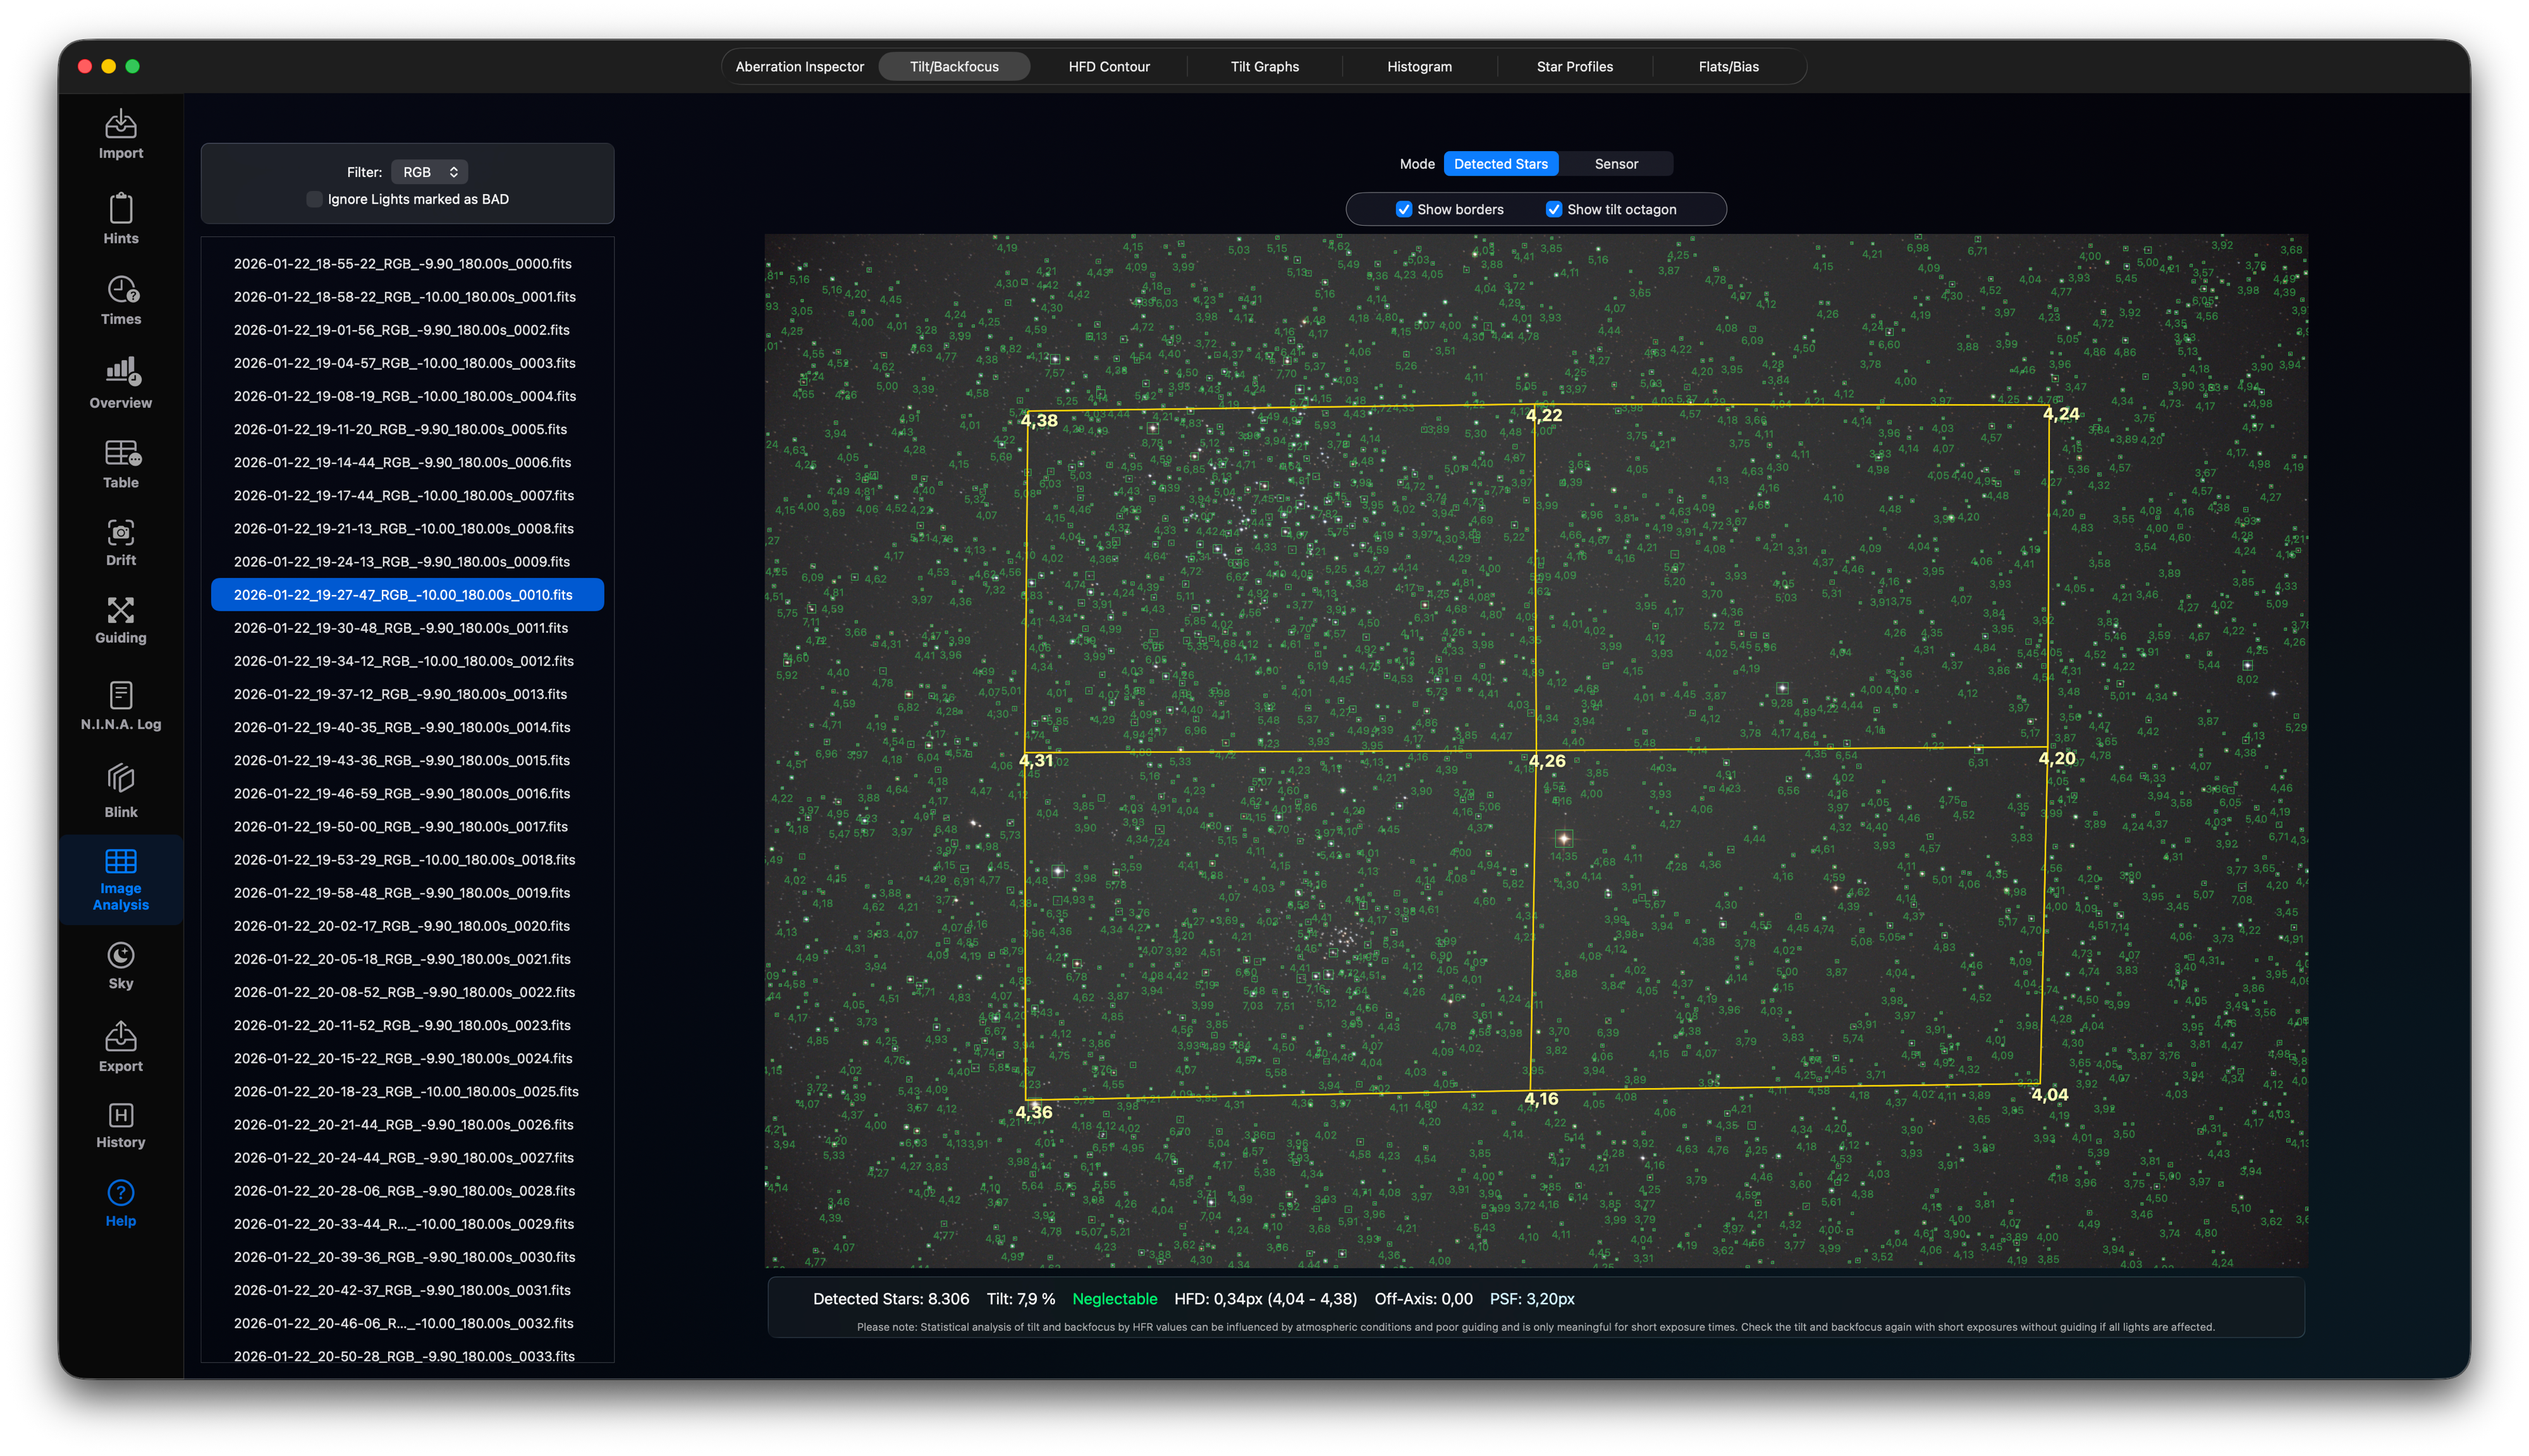
Use the Tilt Inspector to check for tilt and backfocus issues. The detected stars are used to create an octagon, which should be looking like a normal rectangle, if your image does not have tilt. Otherwise have a look below the image to see how strong the tilt is. Smaller values can be ignored and might be due to atmospheric conditions. However, if all your images show some tilt your optics will perhaps need some collimation improvement or your image train is introducing some tilt.
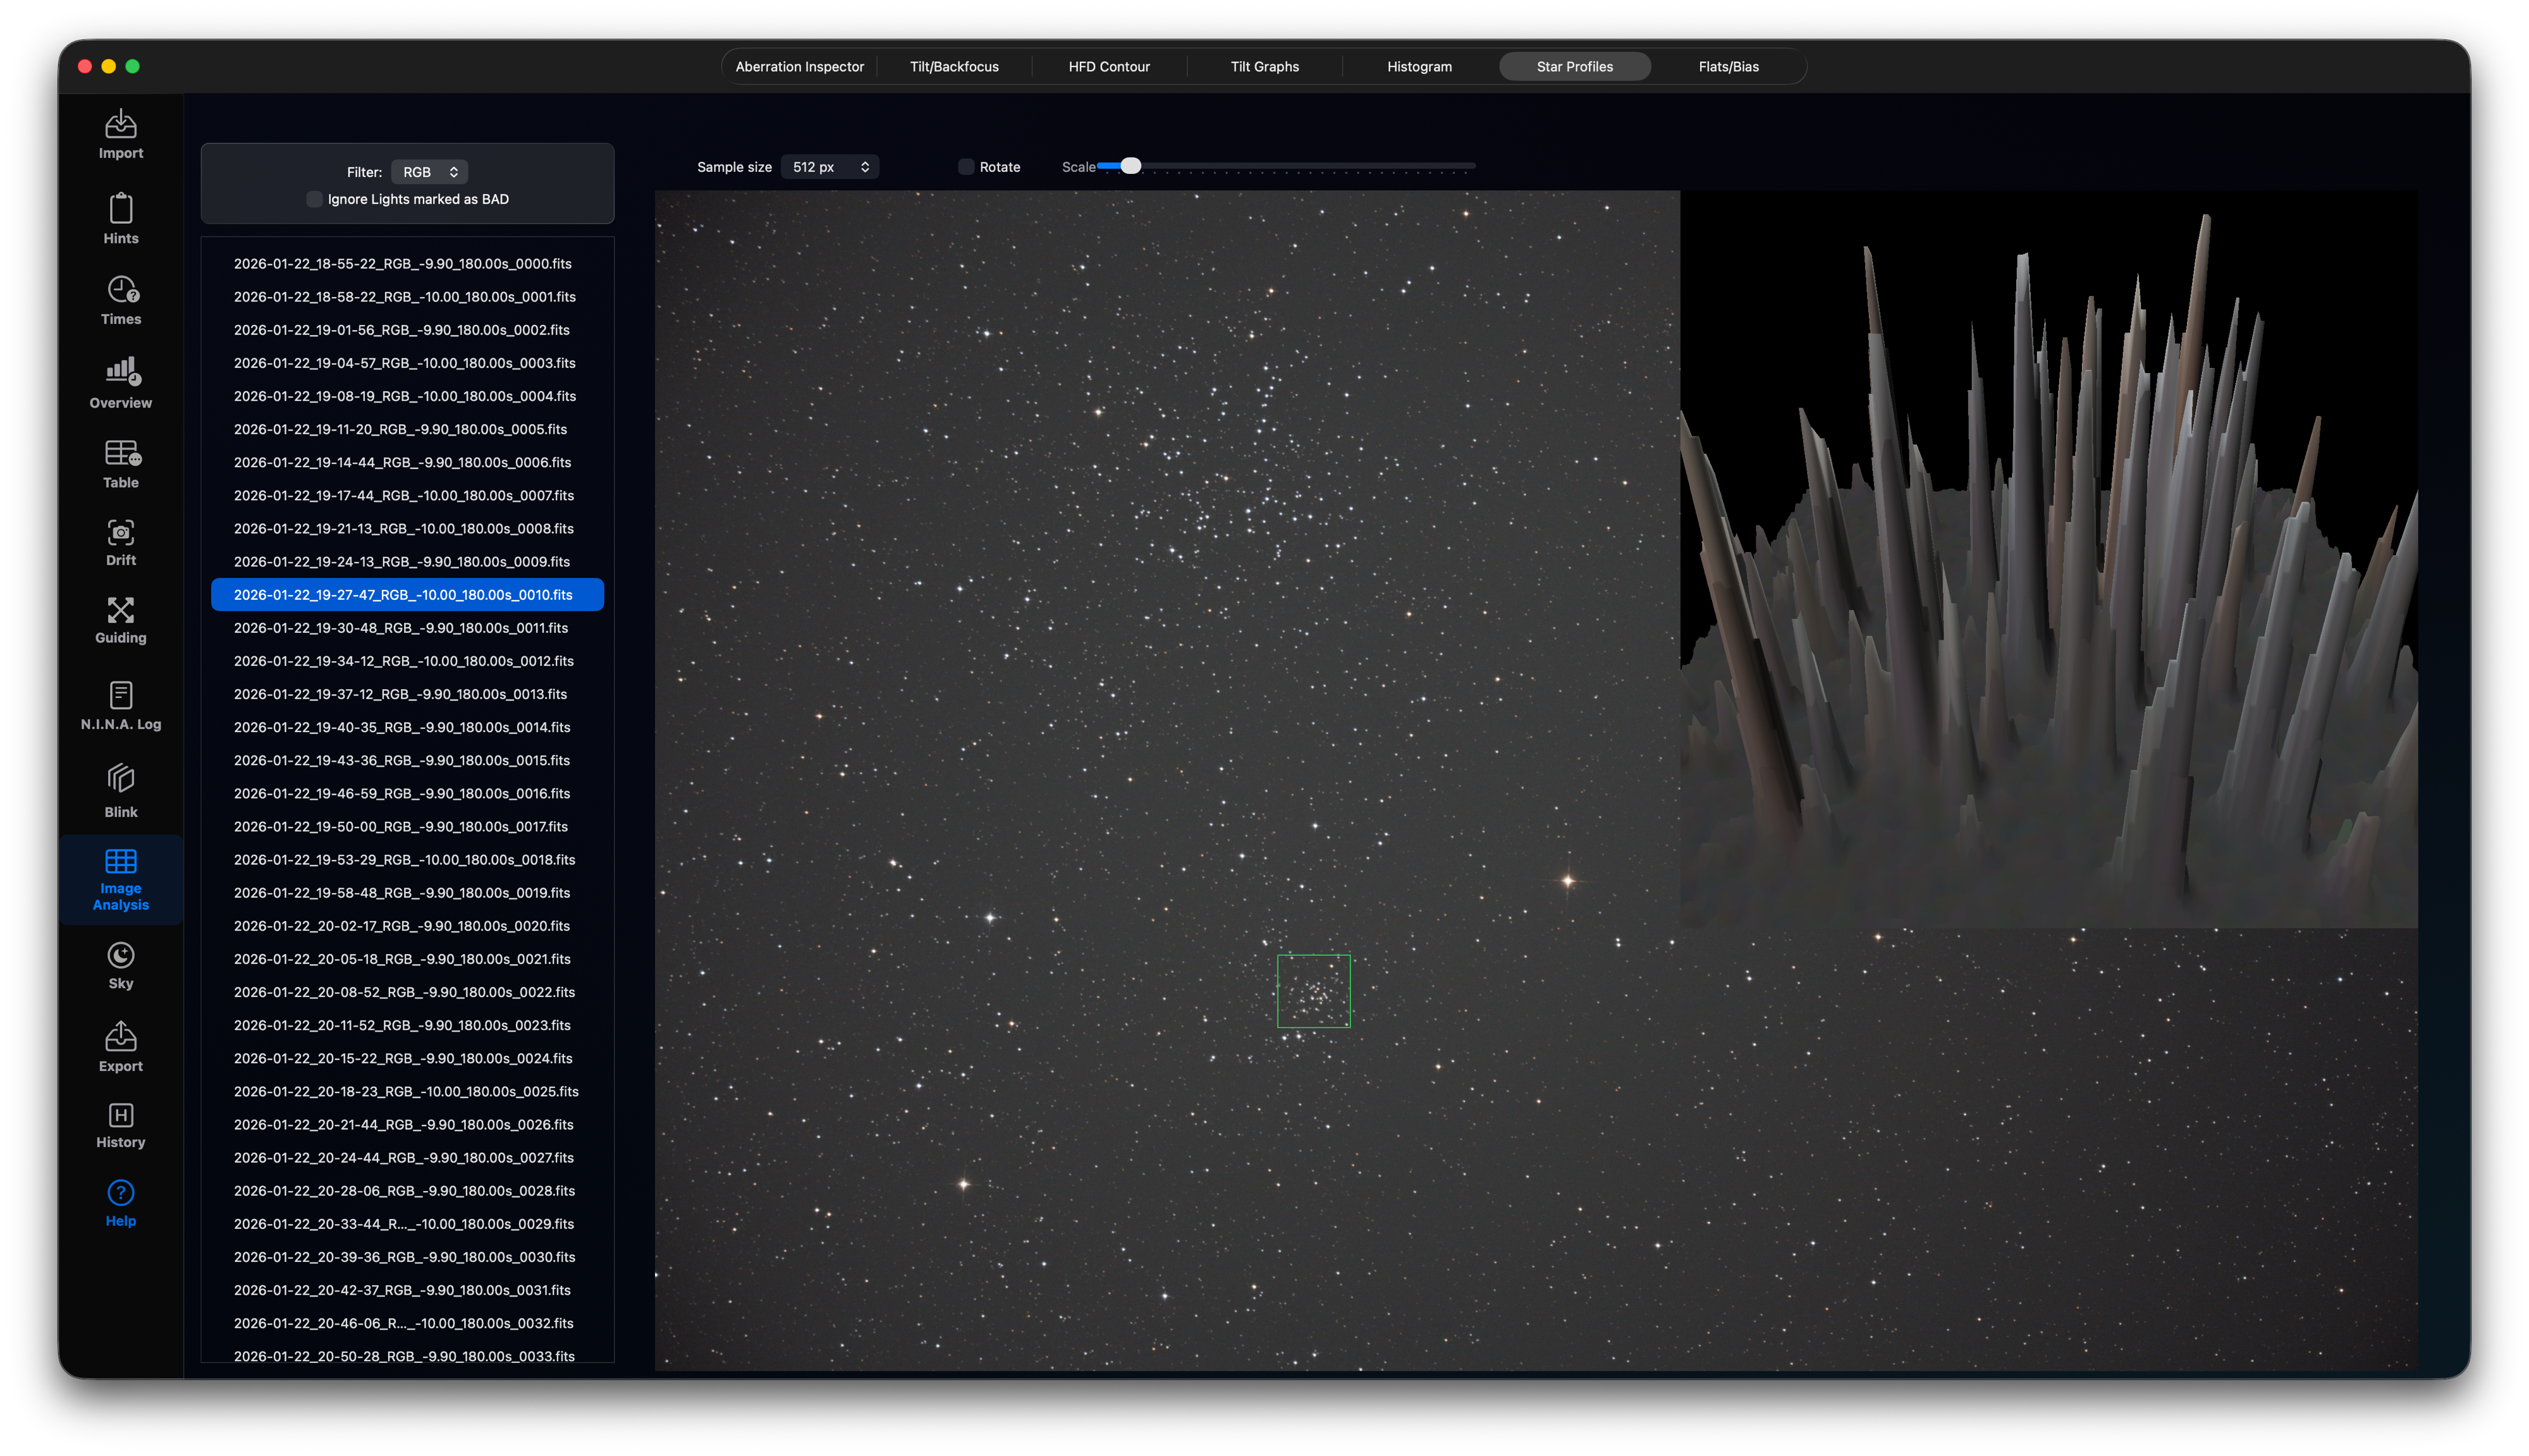
Have a look at your Star Profiles and the background noise in 3D.
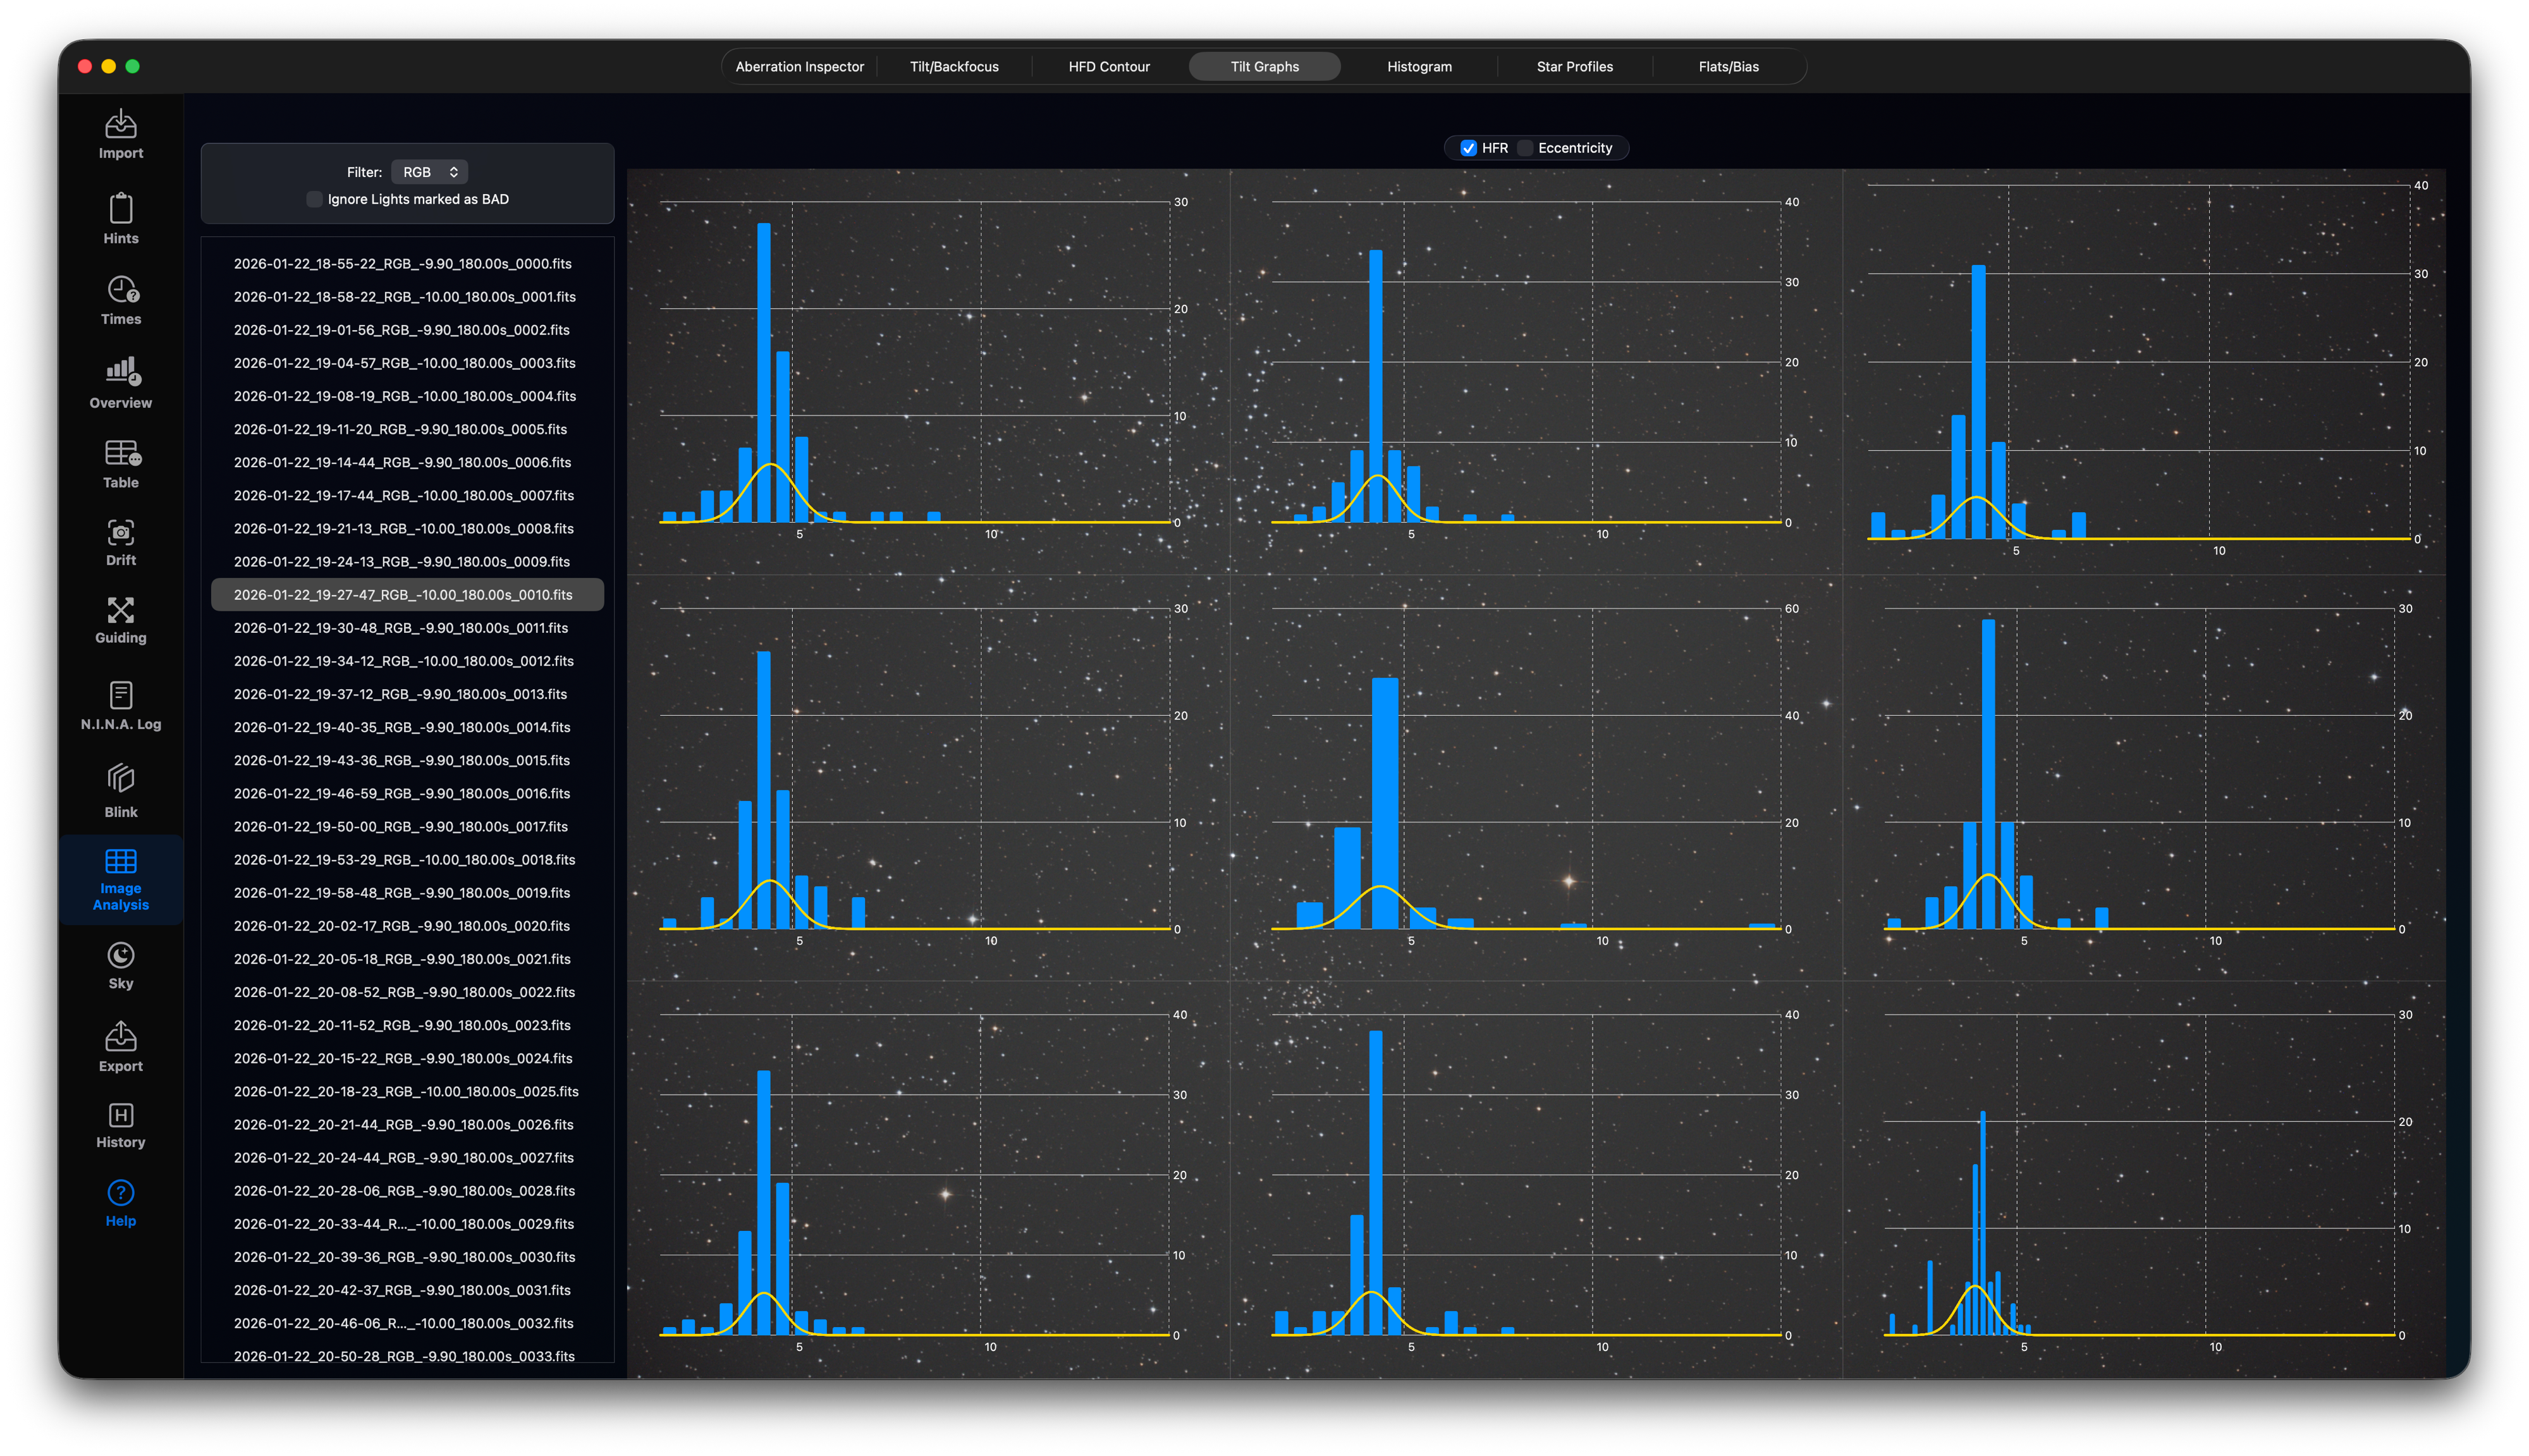
Look at the HFD/Star eccentricity values in all image corners.
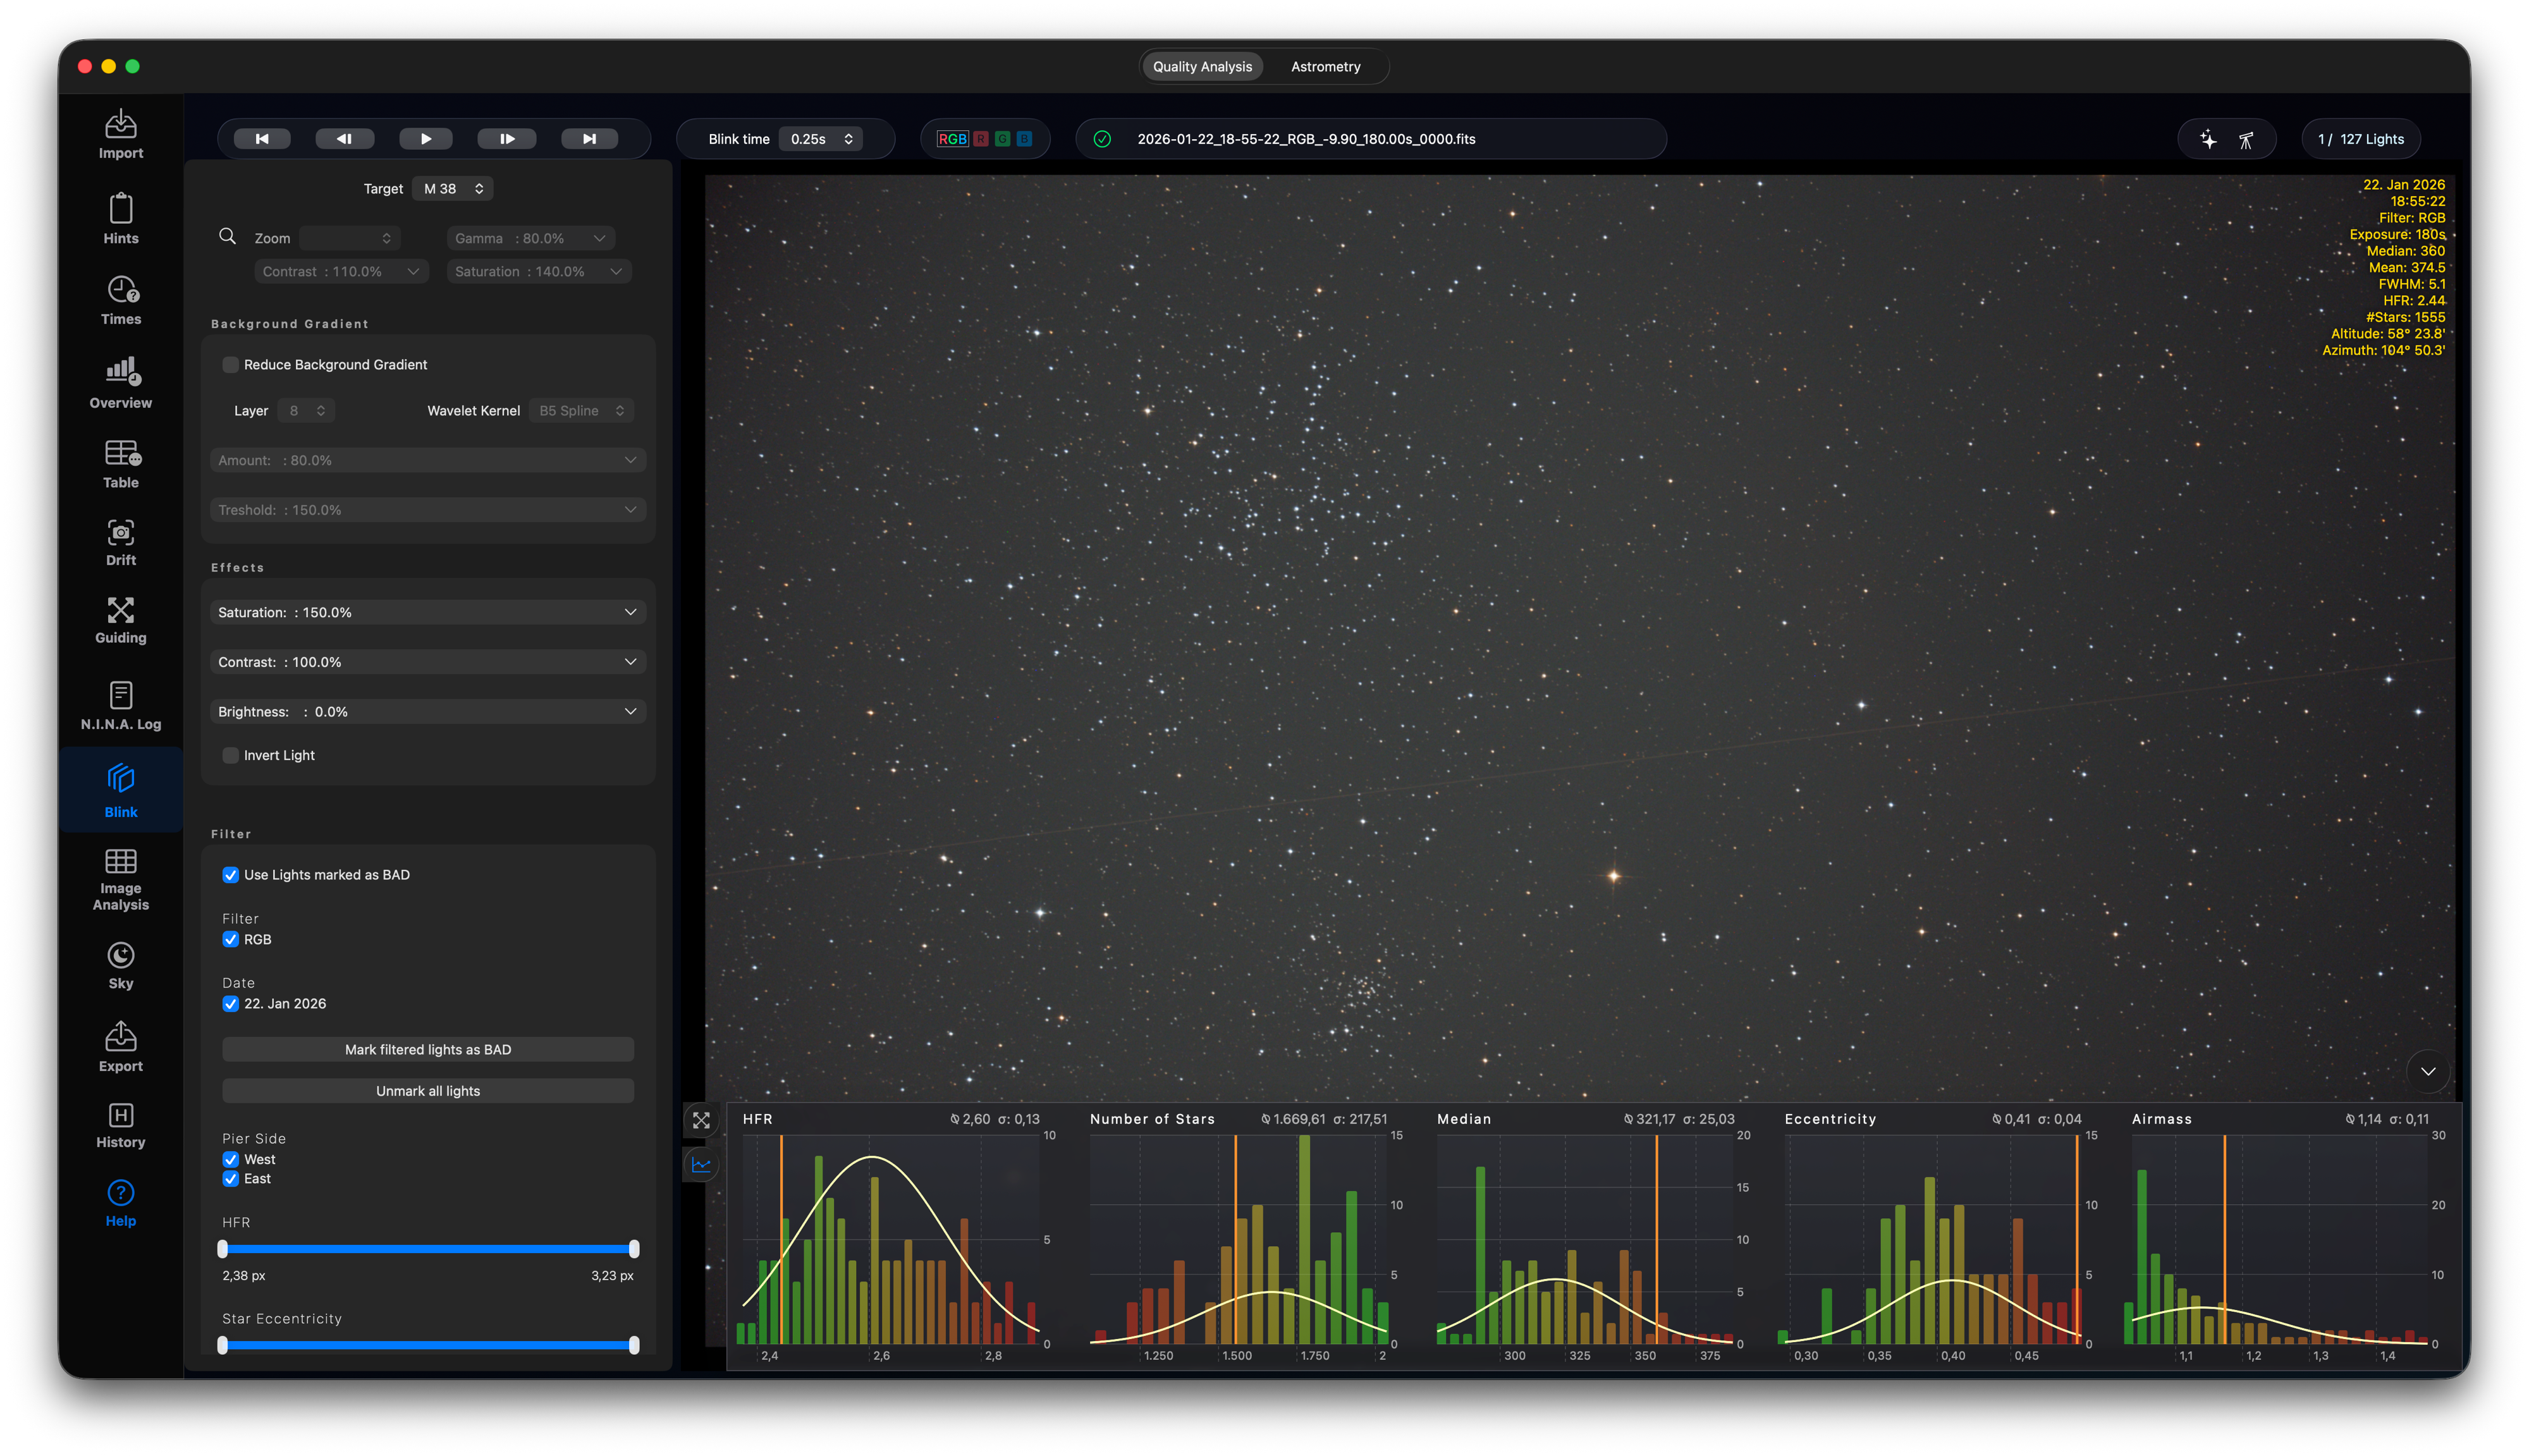
One of the mostly used features is the Blink Tool. You can blink between your images and filter out lights with clouds or other issues. This tool makes blinking flawless, and you will always have all values for the lights at hand, so there is no educated guessing. Sometimes, it can be helpful to reduce any background light gradient.
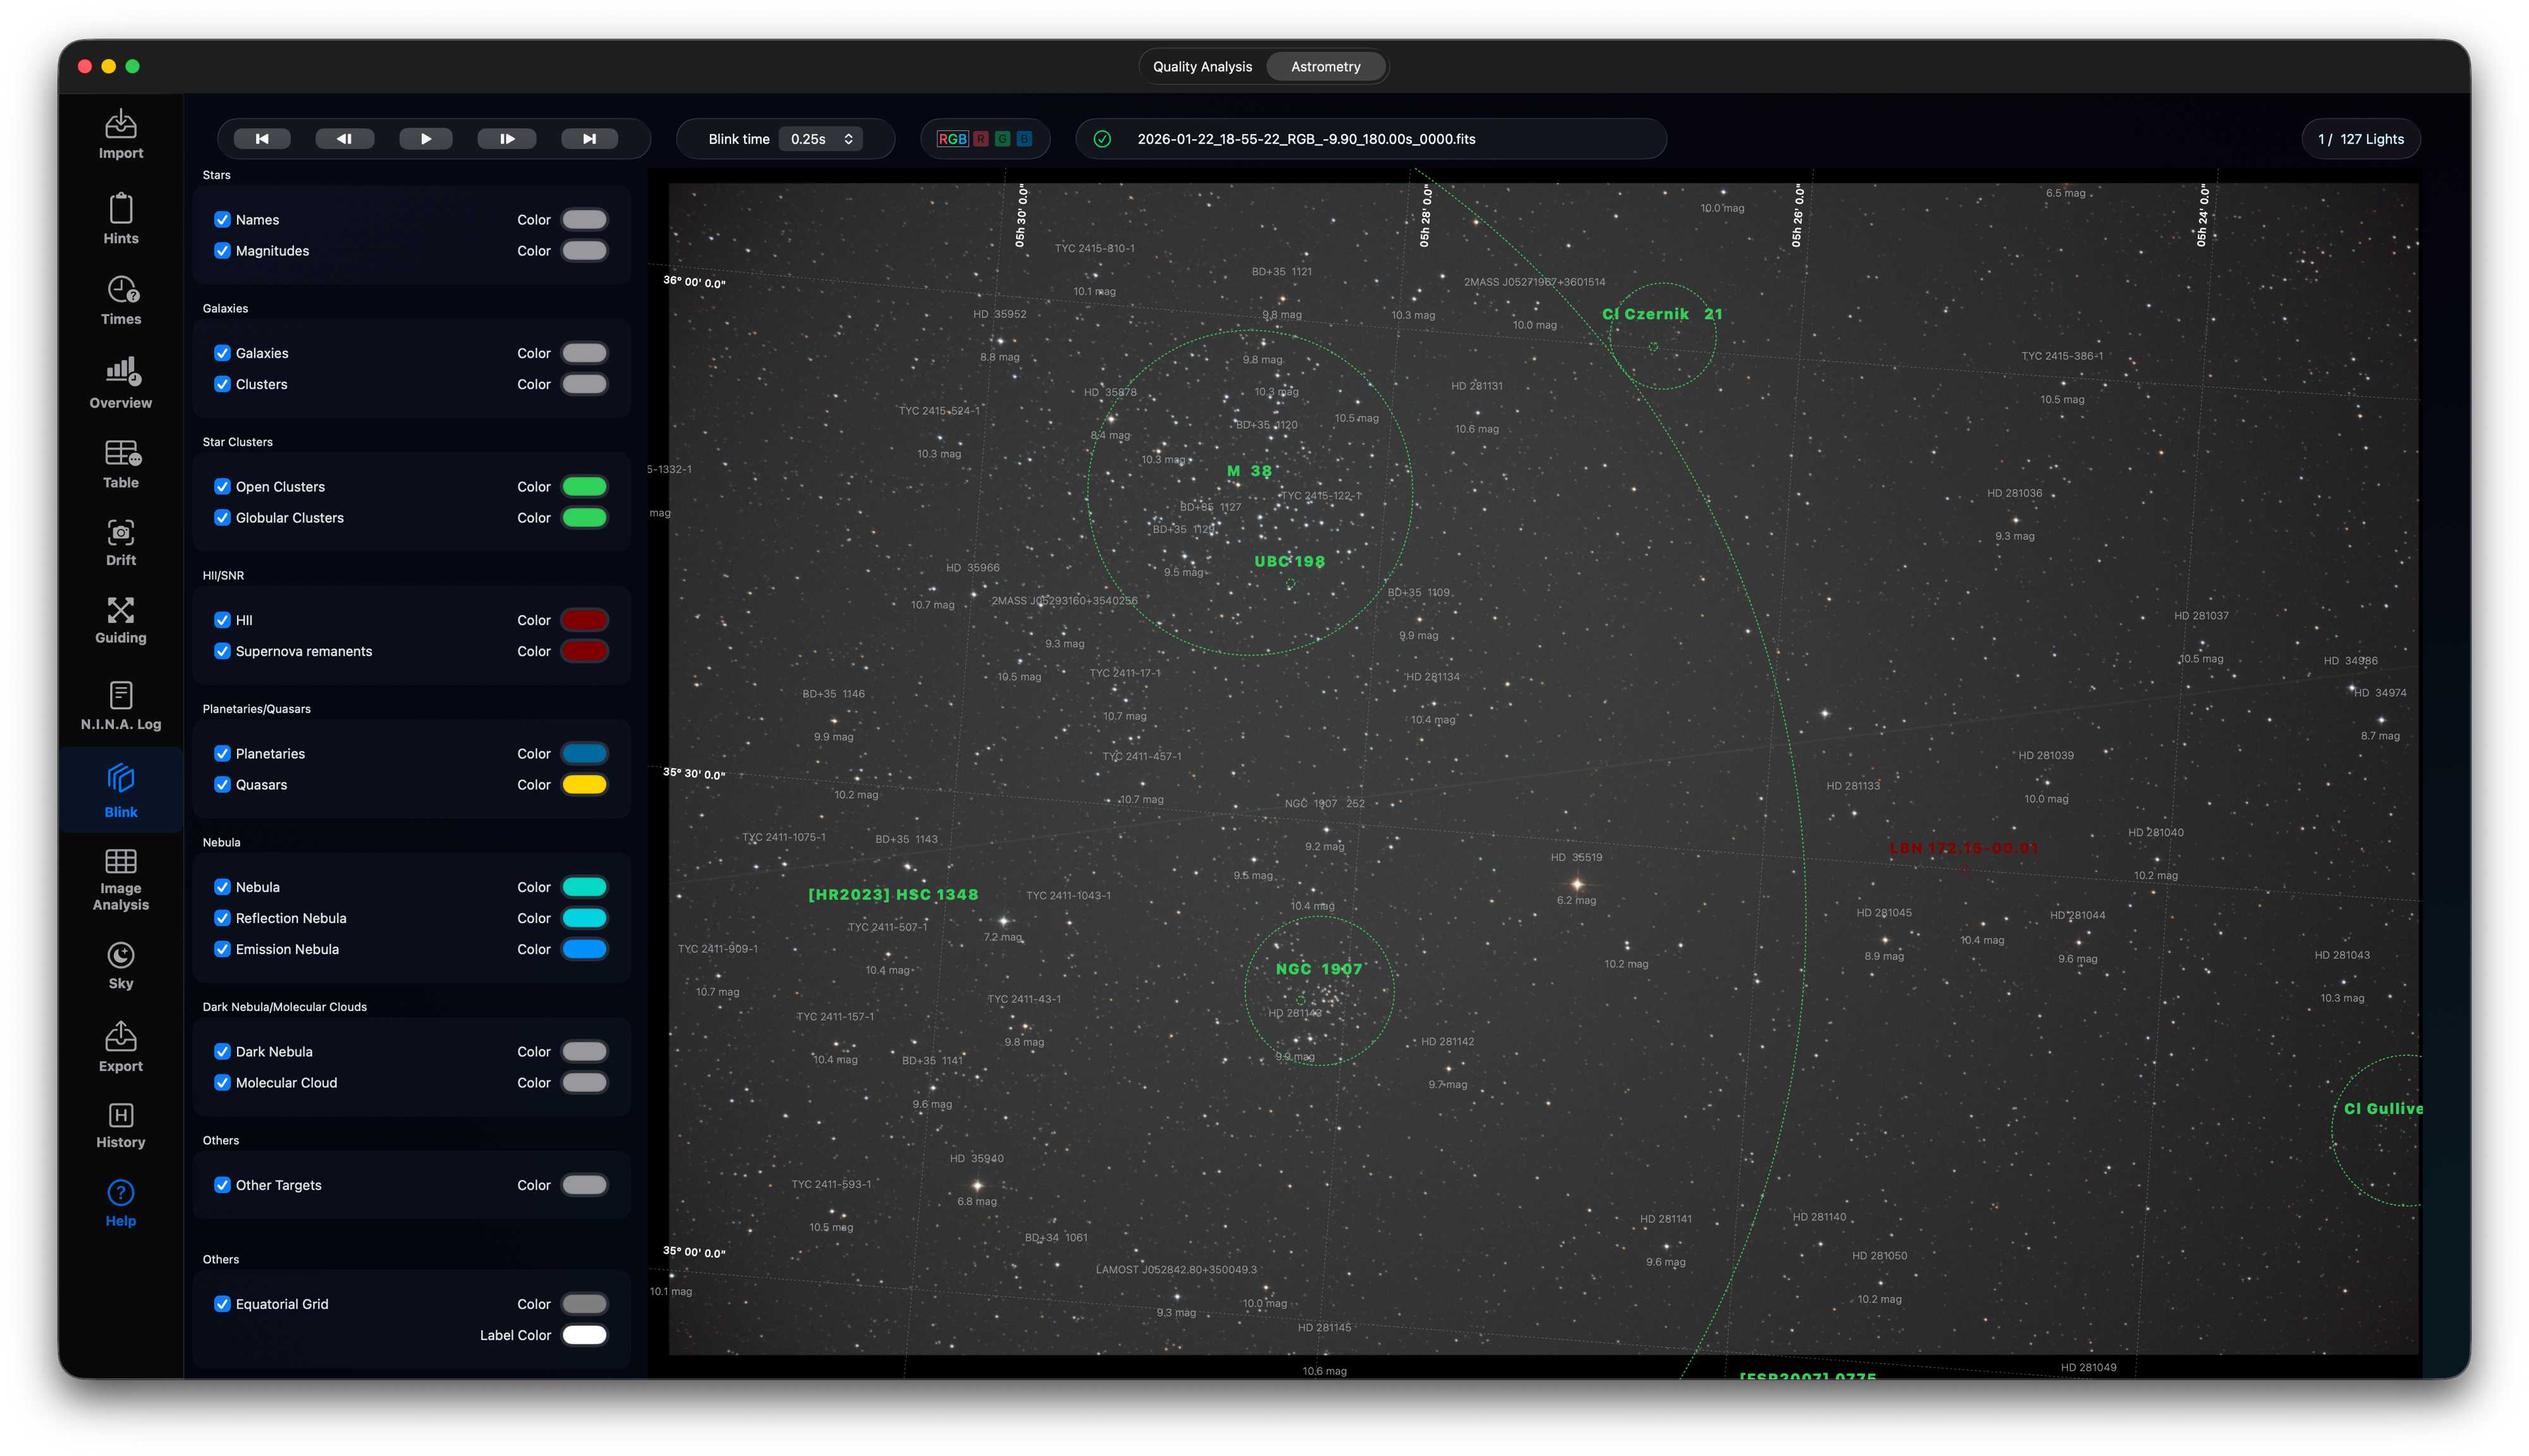
You can also blink between your lights with an astrometrical overlay.
When you archive all your analysed sessions, you can do some more investigations, create projects and attach your astrobin account with your projects. Create a project summary PDF for each project.
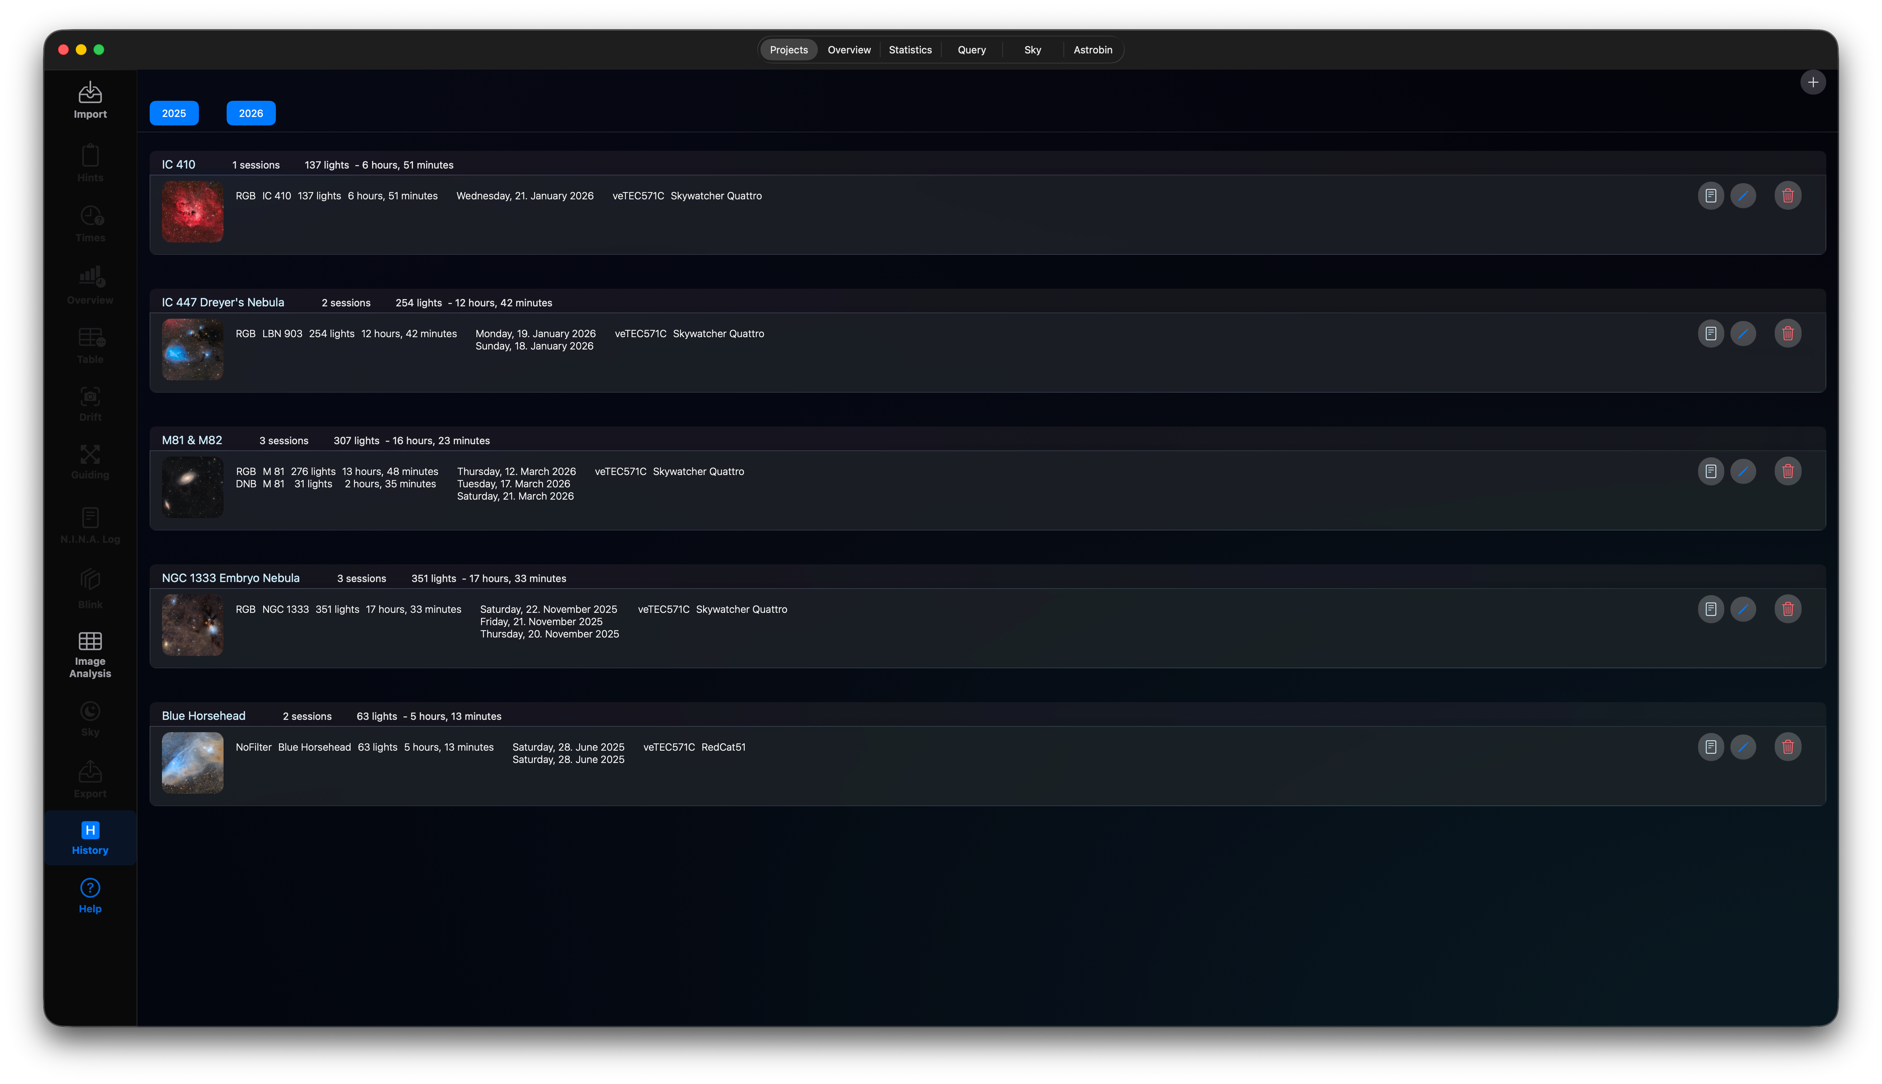
See all your sessions at a glance with all the time spent each night per year.
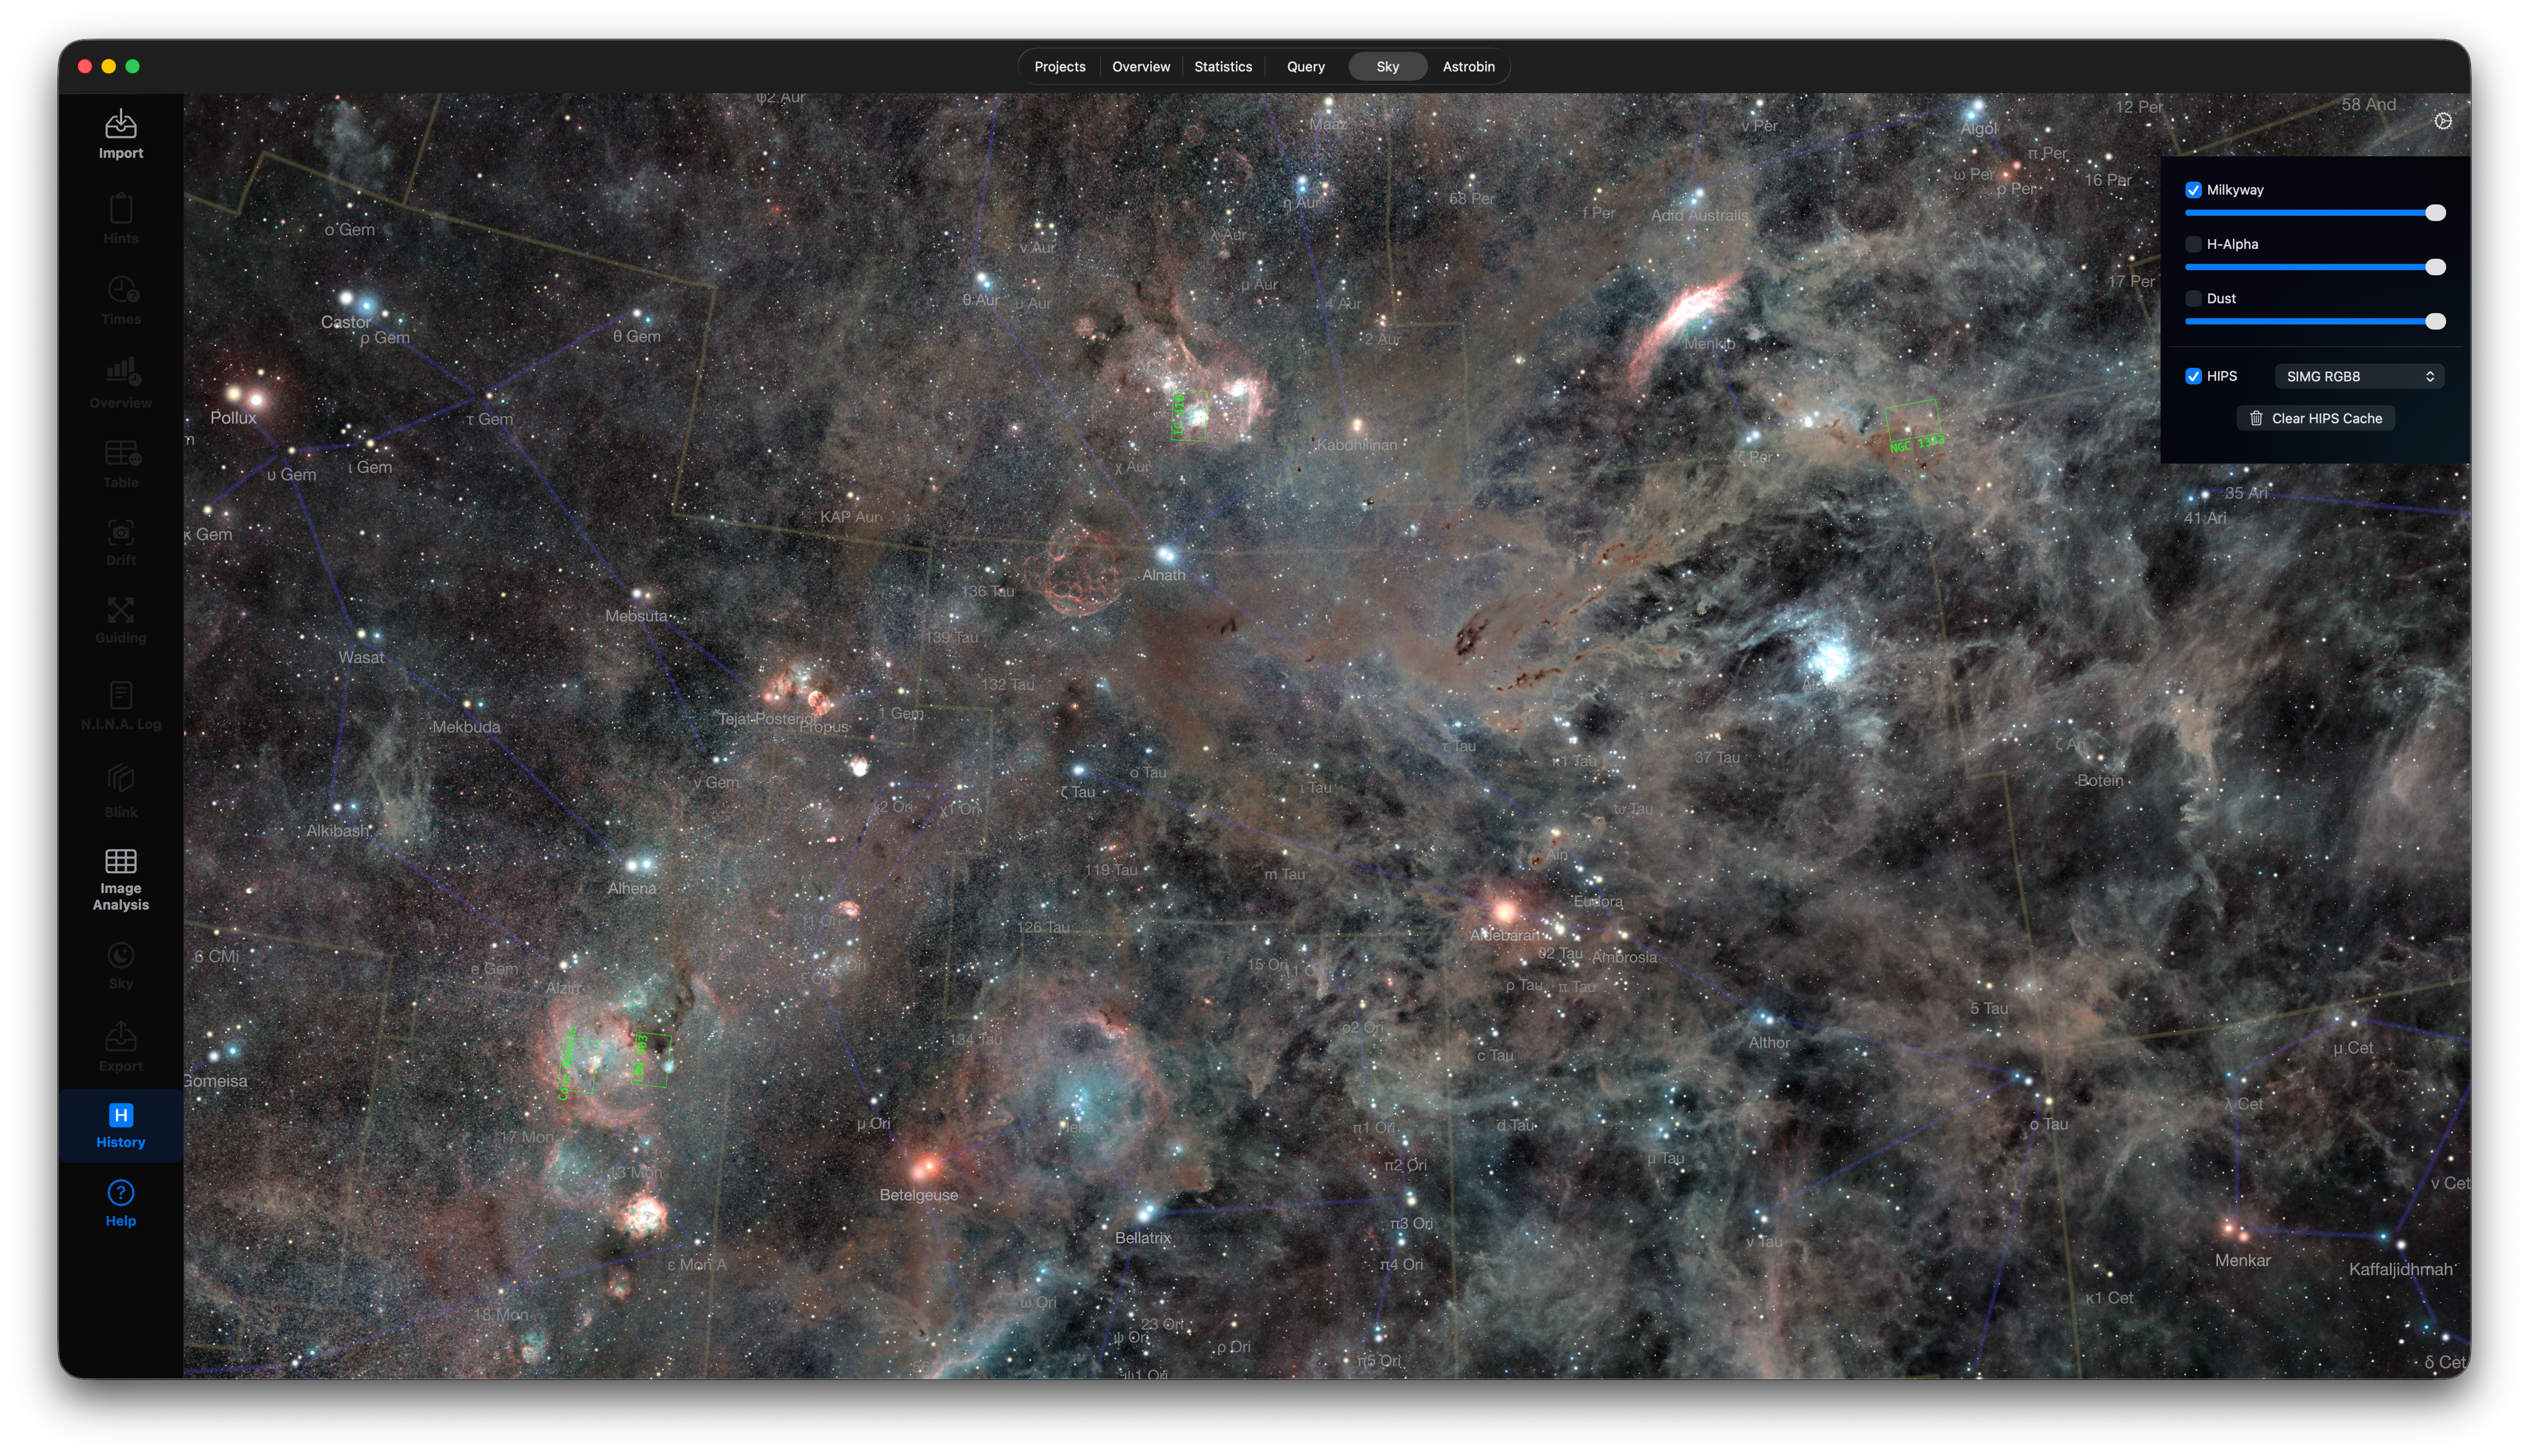
Sea all your sessions in the night sky with optional HIPS overlays.
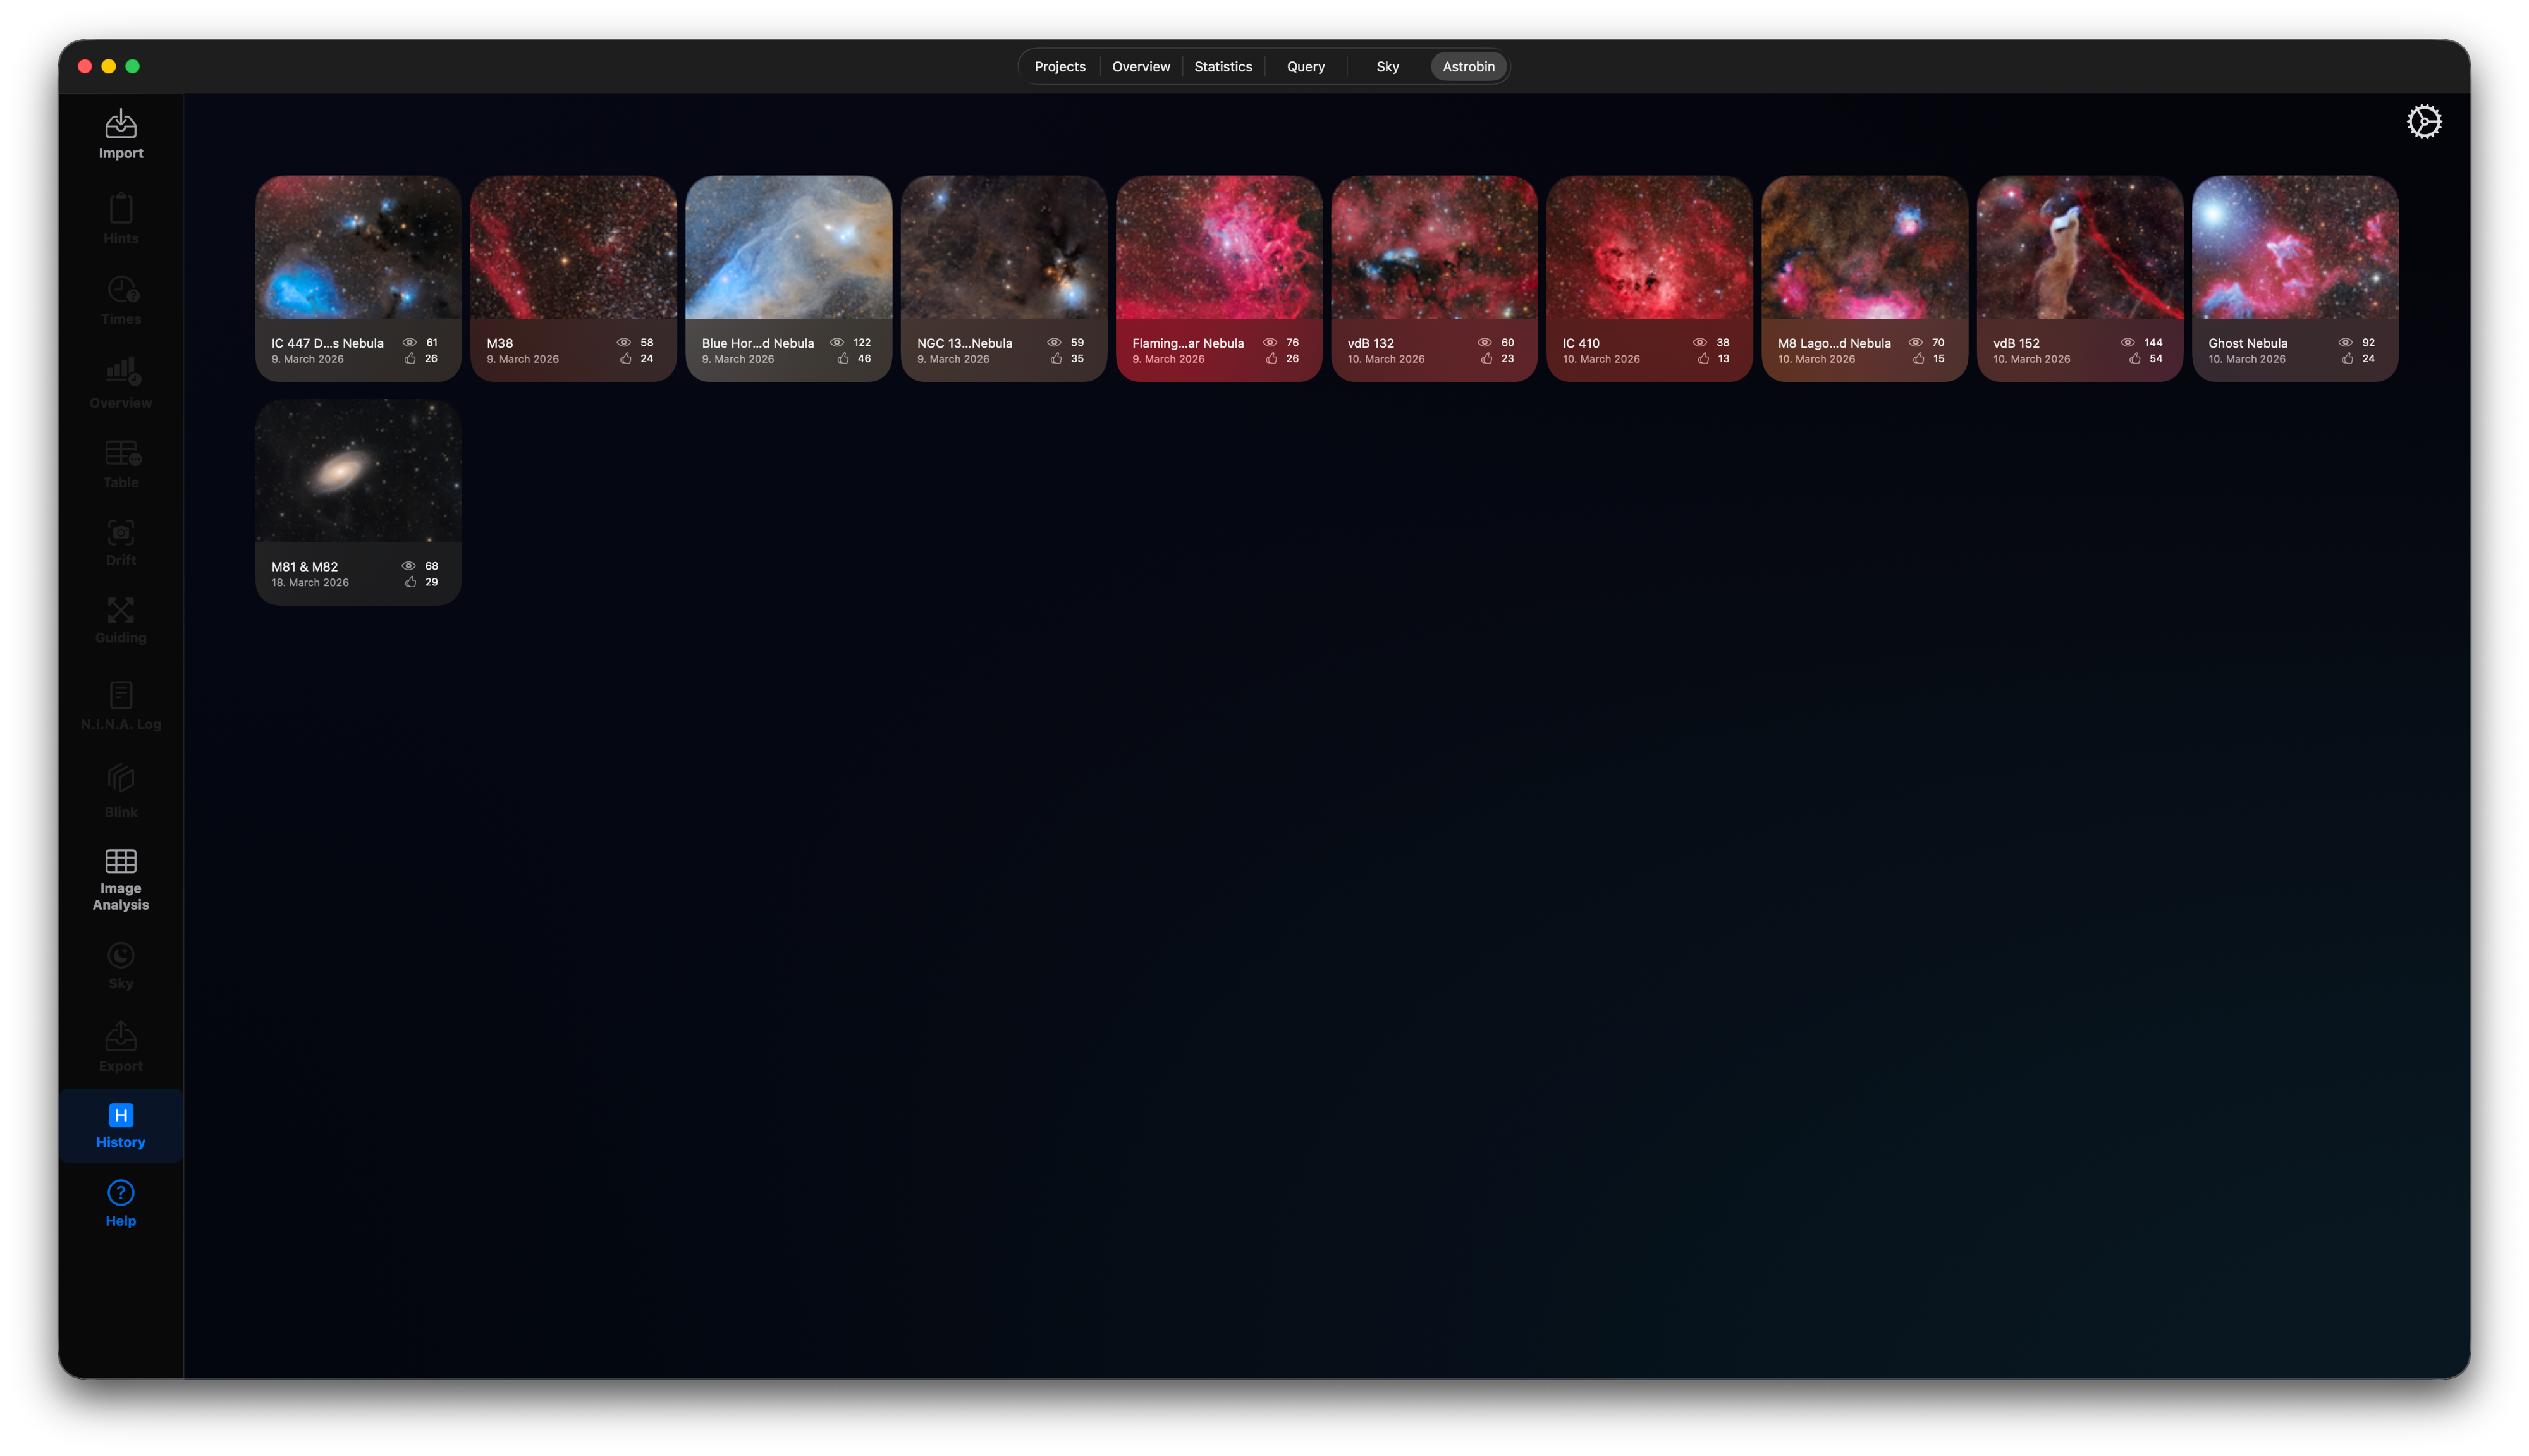
Attach your final images from astrobin to your projects:
Finally, you can also organise or export your lights based on filters. Just use the best lights for stacking or stack all acceptable lights and create a second stack with the just the sharpest lights with the smallest HFD values and combine both stacked images later during processing.